HOT TOPICS LIST
- MACD
- Fibonacci
- RSI
- Gann
- ADXR
- Stochastics
- Volume
- Triangles
- Futures
- Cycles
- Volatility
- ZIGZAG
- MESA
- Retracement
- Aroon
INDICATORS LIST
LIST OF TOPICS
PRINT THIS ARTICLE
by Mike Carr, CMT
At a recent level near $3.25 a gallon, the price of unleaded gas futures is within a small move of its all-time high.
Position: N/A
Mike Carr, CMT
Mike Carr, CMT, is a member of the Market Technicians Association, and editor of the MTA's newsletter, Technically Speaking. He is also the author of "Smarter Investing in Any Economy: The Definitive Guide to Relative Strength Investing," and "Conquering the Divide: How to Use Economic Indicators to Catch Stock Market Trends."
PRINT THIS ARTICLE
STRATEGIES
Gas Prices Nearing Record
04/15/11 08:46:45 AMby Mike Carr, CMT
At a recent level near $3.25 a gallon, the price of unleaded gas futures is within a small move of its all-time high.
Position: N/A
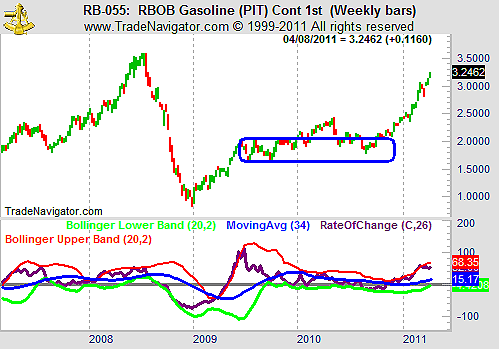
| At the end of 2010, gasoline futures broke out of an 18-month consolidation pattern (Figure 1). A gain of nearly 55% followed, and prices finally looked like they may be extended on the upside in the weekly chart. After piercing the upper Bollinger band, the 26-week rate of change (ROC) indicator is now within the bands and diverging from the recent price high. |

|
| FIGURE 1: RBOB, WEEKLY. The extended consolidation pattern offers an example of how explosive, large moves can follow quiet periods in any market. |
| Graphic provided by: Trade Navigator. |
| |
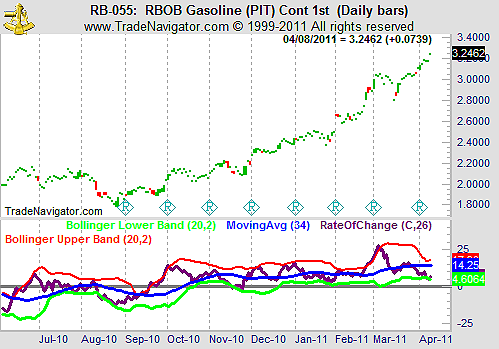
| Unfortunately for consumers, the daily chart shown in Figure 2 offers a more bullish picture. Here we see the ROC indicator near the bottom Bollinger band, which could indicate an oversold condition in the price. The different stories from the different time frames highlight why trading is so difficult, and why it has proven impossible to reduce technical analysis to an absolute and unerring set of precise rules. |

|
| FIGURE 2: RBOB, DAILY. The daily chart of gasoline futures shows a potential short-term oversold extreme in prices, in contrast to the bearish weekly chart. |
| Graphic provided by: Trade Navigator. |
| |
| Another interpretation is that ROC on the daily chart is highlighting the beginning of a potential downtrend in price. The indicator tends to break below the lower band at the beginning of down moves as often as it signals an oversold market. This is consistent with the momentum divergence seen in the weekly chart in Figure 1 and would signal possible relief at the pump this summer for stressed-out consumers. |
| Time will tell whether gas prices move higher or lower from here. Perhaps in time, trading will be reduced to a set of rules that allow for unending profits. But for now, traders should base decisions on price and those long in the unleaded gas market should consider tight stops while those looking for a short entry should consider waiting for a break of previous lows. |
Mike Carr, CMT, is a member of the Market Technicians Association, and editor of the MTA's newsletter, Technically Speaking. He is also the author of "Smarter Investing in Any Economy: The Definitive Guide to Relative Strength Investing," and "Conquering the Divide: How to Use Economic Indicators to Catch Stock Market Trends."
| Website: | www.moneynews.com/blogs/MichaelCarr/id-73 |
| E-mail address: | marketstrategist@gmail.com |
Click here for more information about our publications!
Comments

Request Information From Our Sponsors
- StockCharts.com, Inc.
- Candle Patterns
- Candlestick Charting Explained
- Intermarket Technical Analysis
- John Murphy on Chart Analysis
- John Murphy's Chart Pattern Recognition
- John Murphy's Market Message
- MurphyExplainsMarketAnalysis-Intermarket Analysis
- MurphyExplainsMarketAnalysis-Visual Analysis
- StockCharts.com
- Technical Analysis of the Financial Markets
- The Visual Investor
- VectorVest, Inc.
- Executive Premier Workshop
- One-Day Options Course
- OptionsPro
- Retirement Income Workshop
- Sure-Fire Trading Systems (VectorVest, Inc.)
- Trading as a Business Workshop
- VectorVest 7 EOD
- VectorVest 7 RealTime/IntraDay
- VectorVest AutoTester
- VectorVest Educational Services
- VectorVest OnLine
- VectorVest Options Analyzer
- VectorVest ProGraphics v6.0
- VectorVest ProTrader 7
- VectorVest RealTime Derby Tool
- VectorVest Simulator
- VectorVest Variator
- VectorVest Watchdog
