HOT TOPICS LIST
- MACD
- Fibonacci
- RSI
- Gann
- ADXR
- Stochastics
- Volume
- Triangles
- Futures
- Cycles
- Volatility
- ZIGZAG
- MESA
- Retracement
- Aroon
INDICATORS LIST
LIST OF TOPICS
PRINT THIS ARTICLE
by Chaitali Mohile
CDE is lacking bullish strength to break resistance.
Position: Sell
Chaitali Mohile
Active trader in the Indian stock markets since 2003 and a full-time writer. Trading is largely based upon technical analysis.
PRINT THIS ARTICLE
BREAKOUTS
CDE Breakout Fails
04/18/11 10:45:18 AMby Chaitali Mohile
CDE is lacking bullish strength to break resistance.
Position: Sell
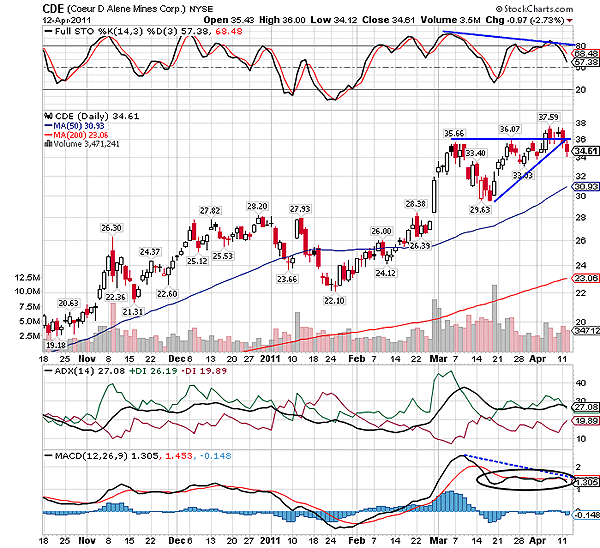
| Coeur D Alene Mines Corp. (CDE) is the largest US-based primary silver producer and a growing gold producer. Recently, CDE has formed a short-term ascending triangle on its daily chart (see Figure 1). The stock initiated a bullish rally from $22, reestablishing the 50-day moving average (MA) support. The advance rally gained $13 over a short period of one and half months. Later, the rally rested in a converging range, forming the ascending triangle. Therefore, the triangle is considered tp be a bullish continuation pattern. An existing uptrend in Figure 1 reconfirms the pattern. In fact, the average directional index (ADX) (14) has descended from the developed region above 30 levels to the developing uptrend level. Hence, the ascending triangle is not a trend reversal pattern for CDE. |

|
| FIGURE 1: CDE, DAILY |
| Graphic provided by: StockCharts.com. |
| |
| The bullish flag & pennant formation and the ascending triangle break in an upwards direction. However, the breakout in Figure 1 failed to surge. Due to the weak momentum reflected by a negative divergence of the full stochastic (14,3,3) and the moving average convergence/divergence (MACD) (12,26,9), CDE could not breach the formation successfully. In addition, the uptrend has declined. Therefore, the stock is likely to plunge some more points from current levels. All the three indicators are highlighting bearish force in their respective bullish areas. The volatility indicated by MACD (12,26,9) in Figure 1 would pour bearish strength in the fresh downside rally. |

|
| FIGURE 2: CDE, WEEKLY |
| Graphic provided by: StockCharts.com. |
| |
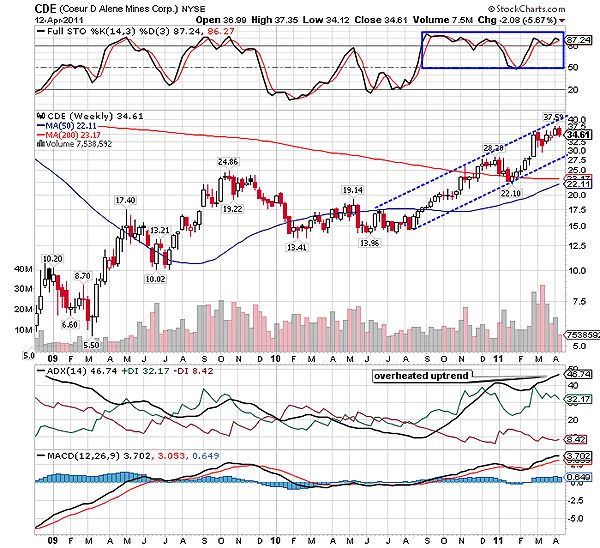
| CDE has moved perfectly in the ascending channel during the entire bullish run in Figure 2. While traveling north of the chart, the 200-day moving average (MA) resistance was breached. Both the trendlines of the channel were subsequently challenged during the rally. The upper trendline discouraged the bullish breakout in Figure 2, resulting in a descending price action towards the lower trendline support. A similar situation has formed at the current higher levels. The upper trendline is restricting the bullish journey of CDE, therefore, the price is ready to retrace to the lower trendline support at $30. |
| A highly overbought stochastic oscillator in Figure 2 has turned shaky in the region. The ADX (14) is signifying overheated uptrend, and the MACD (12,26,9) is jittery in the positive territory. The whole picture points toward an intermediate bearish reversal rally. Due to these reversal conditions, if the lower trendline is breached, the stock has two major moving average supports. In addition, both the moving averages are converging, and therefore, are likely to undergo a bullish crossover in the near future. Hence, the bearish rally would be just a technical correction. On these notes, short-term traders can trigger short positions with the target of the lower trendline support. |
| Thus, the breakout failure of CDE would not damage the bullish sentiments of traders and investors. |
Active trader in the Indian stock markets since 2003 and a full-time writer. Trading is largely based upon technical analysis.
| Company: | Independent |
| Address: | C1/3 Parth Indraprasth Towers. Vastrapur |
| Ahmedabad, Guj 380015 | |
| E-mail address: | chaitalimohile@yahoo.co.in |
Traders' Resource Links | |
| Independent has not added any product or service information to TRADERS' RESOURCE. | |
Click here for more information about our publications!
PRINT THIS ARTICLE

Request Information From Our Sponsors
- StockCharts.com, Inc.
- Candle Patterns
- Candlestick Charting Explained
- Intermarket Technical Analysis
- John Murphy on Chart Analysis
- John Murphy's Chart Pattern Recognition
- John Murphy's Market Message
- MurphyExplainsMarketAnalysis-Intermarket Analysis
- MurphyExplainsMarketAnalysis-Visual Analysis
- StockCharts.com
- Technical Analysis of the Financial Markets
- The Visual Investor
- VectorVest, Inc.
- Executive Premier Workshop
- One-Day Options Course
- OptionsPro
- Retirement Income Workshop
- Sure-Fire Trading Systems (VectorVest, Inc.)
- Trading as a Business Workshop
- VectorVest 7 EOD
- VectorVest 7 RealTime/IntraDay
- VectorVest AutoTester
- VectorVest Educational Services
- VectorVest OnLine
- VectorVest Options Analyzer
- VectorVest ProGraphics v6.0
- VectorVest ProTrader 7
- VectorVest RealTime Derby Tool
- VectorVest Simulator
- VectorVest Variator
- VectorVest Watchdog
