HOT TOPICS LIST
- MACD
- Fibonacci
- RSI
- Gann
- ADXR
- Stochastics
- Volume
- Triangles
- Futures
- Cycles
- Volatility
- ZIGZAG
- MESA
- Retracement
- Aroon
INDICATORS LIST
LIST OF TOPICS
PRINT THIS ARTICLE
by Andrew Hetherington
For the past five years Caterpillar (CAT) has not been known as a market mover. It has bounced anywhere from $30.00 - $65.00 throughout this period. It is now time for a move upwards.
Position: N/A
Andrew Hetherington
Classic Dow Theorist who trades as a pure technician, using pattern recognition.
PRINT THIS ARTICLE
SYMMETRICAL TRIANGLE
Caterpillar Inching Forward
03/05/02 07:51:23 AMby Andrew Hetherington
For the past five years Caterpillar (CAT) has not been known as a market mover. It has bounced anywhere from $30.00 - $65.00 throughout this period. It is now time for a move upwards.
Position: N/A
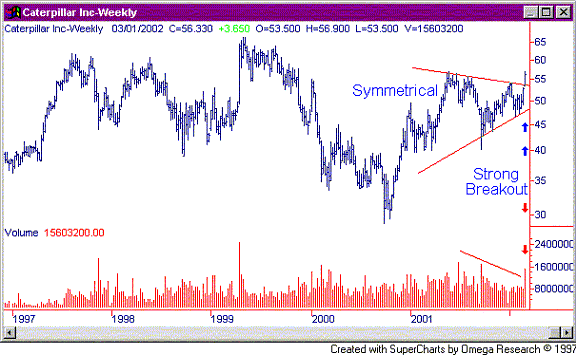
| Figure 1 shows a weekly chart of Caterpillar Inc. A large 9-month symmetrical triangle formed in 2001 on very good diminishing volume and a strong breakout occured last week on almost 16 million shares. In addition to this promising development, CAT has dividend and equity growth from this point forward and makes a very attractive medium to long-term hold, particularly for those on fixed incomes. |
| My expectations are for a rise upwards to the all-time high of $66.44 that occurred in May of 1999, and to eventually surpass this resistance area. Keep in mind that Caterpillar is not a fast mover, but you should catch it at the right time if you purchase a long position in the low to mid $50.00 area. |

|
| Figure 1: Weekly chart for CAT. |
| Graphic provided by: SuperCharts. |
| |
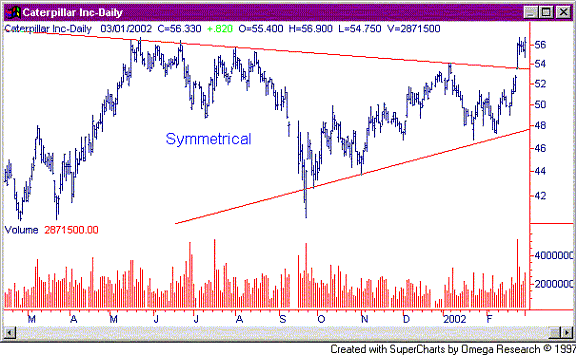
| On the smaller picture, shown in Figure 2, a strong breakout with 5.2 million shares occured last Monday, February 25, 2002. CAT then formed a flag for a very brief throwback and resumed the uptrend on Friday with a one-day reversal. Although the volume was not huge for this reversal, it was still significant. The volume picked up after moving away from this consolidation area, illustrating underlying strength. |
 Figure 2: Daily chart for CAT. Naturally, short-term speculators might not think this style of play is for them, but when the pickings become slim it is food for thought. |
Classic Dow Theorist who trades as a pure technician, using pattern recognition.
| Toronto, Canada |
Click here for more information about our publications!
Comments
Date: 03/05/02Rank: 5Comment:
Date: 03/06/02Rank: 1Comment: Useless
Date: 03/15/02Rank: 4Comment:

|

Request Information From Our Sponsors
- StockCharts.com, Inc.
- Candle Patterns
- Candlestick Charting Explained
- Intermarket Technical Analysis
- John Murphy on Chart Analysis
- John Murphy's Chart Pattern Recognition
- John Murphy's Market Message
- MurphyExplainsMarketAnalysis-Intermarket Analysis
- MurphyExplainsMarketAnalysis-Visual Analysis
- StockCharts.com
- Technical Analysis of the Financial Markets
- The Visual Investor
- VectorVest, Inc.
- Executive Premier Workshop
- One-Day Options Course
- OptionsPro
- Retirement Income Workshop
- Sure-Fire Trading Systems (VectorVest, Inc.)
- Trading as a Business Workshop
- VectorVest 7 EOD
- VectorVest 7 RealTime/IntraDay
- VectorVest AutoTester
- VectorVest Educational Services
- VectorVest OnLine
- VectorVest Options Analyzer
- VectorVest ProGraphics v6.0
- VectorVest ProTrader 7
- VectorVest RealTime Derby Tool
- VectorVest Simulator
- VectorVest Variator
- VectorVest Watchdog
