HOT TOPICS LIST
- MACD
- Fibonacci
- RSI
- Gann
- ADXR
- Stochastics
- Volume
- Triangles
- Futures
- Cycles
- Volatility
- ZIGZAG
- MESA
- Retracement
- Aroon
INDICATORS LIST
LIST OF TOPICS
PRINT THIS ARTICLE
by Donald W. Pendergast, Jr.
Most of the time, a trader is better off not adding too much (if any) extra trade entry confirmation to an otherwise successful trading system's signal output. But it's still nice to have some attractive chart patterns and dynamics working in the trade's favor, regardless.
Position: Sell
Donald W. Pendergast, Jr.
Donald W. Pendergast is a financial markets consultant who offers specialized services to stock brokers and high net worth individuals who seek a better bottom line for their portfolios.
PRINT THIS ARTICLE
TRADING SYSTEMS
BAC's Compelling Short Setup?
04/15/11 08:35:14 AMby Donald W. Pendergast, Jr.
Most of the time, a trader is better off not adding too much (if any) extra trade entry confirmation to an otherwise successful trading system's signal output. But it's still nice to have some attractive chart patterns and dynamics working in the trade's favor, regardless.
Position: Sell
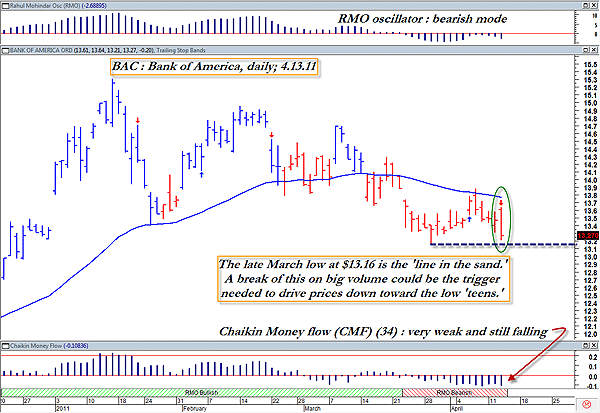
| The banking sector stocks made an amazing turnaround after cratering in early 2009. Back then, you could scoop up shares of Bank of America (BAC) at the bargain-basement price of only $3.86 per share, but how many potential investors in the shares were too afraid to take positions, what with the economic landscape looking as bleak as it ever had since the Great Depression of the 1930s? Figure 1 is a look at a very good mechanical trading strategy's latest sell signal in shares of BAC -- it's from the Rahul Mohindar oscillator (RMO) trading system that comes standard in MetaStock 11 -- along with the powerful chart dynamics that would seem to be lending a helping hand toward guiding the stock to lower valuation levels. |

|
| FIGURE 1: BAC, DAILY. Some trade setups win and some don't, but in the case of a new short sell signal from an otherwise powerful trading system, when it occurs on big volume and wide range at a seasonally bearish time in the broad markets -- and at a price level close to key support -- well, that might help ease the fears of those hesitant to pull the trigger on the trade in the first place. |
| Graphic provided by: MetaStock. |
| Graphic provided by: Rahul Mohindar RMO indicators from MetaStock 11. |
| |
| Here's the basic walk-through of the trade setup we see here: * A new RMO trading system swing sell signal has just fired. * Money flow looks rather nasty, and is growing weaker, as depicted by the Chaikin money flow (CMF)(34). * Momentum is definitely faltering, per the RMO oscillator's histogram at the top of the chart. * BAC is also quite a bit weaker than the .SPX in terms of its 13-week comparative relative strength ranking. * The signal bar (on Wednesday) is of exceptionally wide range, hinting that at least some institutional players may be more than ready to continue unloading shares over the next few sessions. * A break of $13.16 on continued strong volume could trigger even more heavy selling, as that is the price level of the March 29, 2011 low (see dashed blue line on chart). |
| While no one knows how this short trade setup will play out, the fact that it is occurring in such a prominent large-cap issue at a time of the year when the broad US markets typically go into some kind of consolidating and/or corrective mode can only help to alert traders and investors that now is a terrific time to play a good offense -- inasmuch as one's financial well-being could be at risk if one continues to play along with the "buy on dips" mindset with reckless abandon. If you've still got big stock positions on, be sure to consider the possibility of purchasing some put options as insurance, just in case we are on the cusp of a large-scale decline. And if you're a skilled short seller, by all means do some further investigation on your own and see if this setup is a good fit for your own level of experience and risk tolerance. In case you're neither kind of trader, then why not just sit on the sidelines for a while until the broad market provides further evidence that a meaningful high is already in place for the next few months? |
Donald W. Pendergast is a financial markets consultant who offers specialized services to stock brokers and high net worth individuals who seek a better bottom line for their portfolios.
| Title: | Writer, market consultant |
| Company: | Linear Trading Systems LLC |
| Jacksonville, FL 32217 | |
| Phone # for sales: | 904-239-9564 |
| E-mail address: | lineartradingsys@gmail.com |
Traders' Resource Links | |
| Linear Trading Systems LLC has not added any product or service information to TRADERS' RESOURCE. | |
Click here for more information about our publications!
PRINT THIS ARTICLE

Request Information From Our Sponsors
- StockCharts.com, Inc.
- Candle Patterns
- Candlestick Charting Explained
- Intermarket Technical Analysis
- John Murphy on Chart Analysis
- John Murphy's Chart Pattern Recognition
- John Murphy's Market Message
- MurphyExplainsMarketAnalysis-Intermarket Analysis
- MurphyExplainsMarketAnalysis-Visual Analysis
- StockCharts.com
- Technical Analysis of the Financial Markets
- The Visual Investor
- VectorVest, Inc.
- Executive Premier Workshop
- One-Day Options Course
- OptionsPro
- Retirement Income Workshop
- Sure-Fire Trading Systems (VectorVest, Inc.)
- Trading as a Business Workshop
- VectorVest 7 EOD
- VectorVest 7 RealTime/IntraDay
- VectorVest AutoTester
- VectorVest Educational Services
- VectorVest OnLine
- VectorVest Options Analyzer
- VectorVest ProGraphics v6.0
- VectorVest ProTrader 7
- VectorVest RealTime Derby Tool
- VectorVest Simulator
- VectorVest Variator
- VectorVest Watchdog
