HOT TOPICS LIST
- MACD
- Fibonacci
- RSI
- Gann
- ADXR
- Stochastics
- Volume
- Triangles
- Futures
- Cycles
- Volatility
- ZIGZAG
- MESA
- Retracement
- Aroon
INDICATORS LIST
LIST OF TOPICS
PRINT THIS ARTICLE
by Chaitali Mohile
The US Dollar Index has moved into a deep downtrend. The bearish pressure is likely to drag the index toward the lowest support on the technical charts.
Position: Hold
Chaitali Mohile
Active trader in the Indian stock markets since 2003 and a full-time writer. Trading is largely based upon technical analysis.
PRINT THIS ARTICLE
SUPPORT & RESISTANCE
Weakness In US Dollar Index
04/13/11 01:10:54 PMby Chaitali Mohile
The US Dollar Index has moved into a deep downtrend. The bearish pressure is likely to drag the index toward the lowest support on the technical charts.
Position: Hold
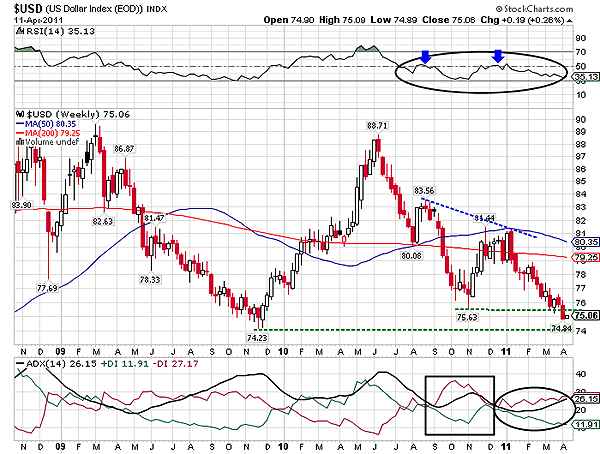
| Since mid-2010, the US Dollar Index ($USD) has lost nearly 13 points from the highest peak. Initially, the index witnessed a vertical fall, shedding eight points from the 88 levels. After hitting the 200-day moving average (MA) support, the bulls tried their luck but could not succeed. The series of lower highs began as the 200-day MA support was converted to resistance. Thereafter, the bulls disappeared from the scene and the bears grew stronger. The low at 75 levels formed during the bearish rally developed robust support-resistance for the ongoing as well as future rally. The relative strength index (RSI) (14) in Figure 1 is under bearish pressure; as a result, the indicators formed a double top at the 50 levels. This center line would remain a strong resistance for the oscillator. |

|
| FIGURE 1: $USD, WEEKLY |
| Graphic provided by: StockCharts.com. |
| |
| The pullback rally from the 75 level was terminated by the 50-day moving average (MA) resistance. Thereafter, $USD took a nosedive from 81, breaching the support of 75 levels. The next level at 74 is the historical support for the index. The average directional index (ADX) (14) shows that the index has moved comfortably in a developing downtrend region above 20 levels. The RSI (14) is ready to plunge in oversold region, and therefore, the index has more downside. The immediate support of 74 levels is under threat. |

|
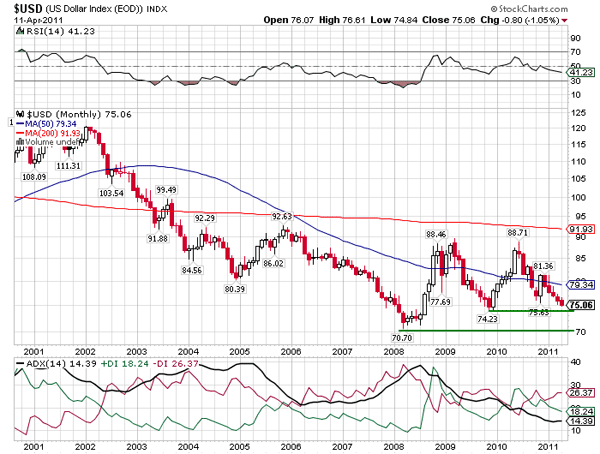
| FIGURE 2: $USD, MONTHLY |
| Graphic provided by: StockCharts.com. |
| |
| The monthly chart shows another support at 70.70 levels in Figure 2. In 2008, the $USD had began its bullish reversal rally with the support of 70 levels, making it major support for the current descending rally. The trend indicator is weak and the RSI (14) has plunged in a no-man's land. Therefore, the weakness is likely to pull the index down further. The current economical conditions across the world are not similar to that of 2008, so hitting the 70 levels support would be difficult. However, the index would remain pretty volatile below 74 levels. |
| $USD is facing tremendous bearish pressure at these lower levels. Thus, the weakness would develop high volatility near the lowest low. |
Active trader in the Indian stock markets since 2003 and a full-time writer. Trading is largely based upon technical analysis.
| Company: | Independent |
| Address: | C1/3 Parth Indraprasth Towers. Vastrapur |
| Ahmedabad, Guj 380015 | |
| E-mail address: | chaitalimohile@yahoo.co.in |
Traders' Resource Links | |
| Independent has not added any product or service information to TRADERS' RESOURCE. | |
Click here for more information about our publications!
Comments

Request Information From Our Sponsors
- StockCharts.com, Inc.
- Candle Patterns
- Candlestick Charting Explained
- Intermarket Technical Analysis
- John Murphy on Chart Analysis
- John Murphy's Chart Pattern Recognition
- John Murphy's Market Message
- MurphyExplainsMarketAnalysis-Intermarket Analysis
- MurphyExplainsMarketAnalysis-Visual Analysis
- StockCharts.com
- Technical Analysis of the Financial Markets
- The Visual Investor
- VectorVest, Inc.
- Executive Premier Workshop
- One-Day Options Course
- OptionsPro
- Retirement Income Workshop
- Sure-Fire Trading Systems (VectorVest, Inc.)
- Trading as a Business Workshop
- VectorVest 7 EOD
- VectorVest 7 RealTime/IntraDay
- VectorVest AutoTester
- VectorVest Educational Services
- VectorVest OnLine
- VectorVest Options Analyzer
- VectorVest ProGraphics v6.0
- VectorVest ProTrader 7
- VectorVest RealTime Derby Tool
- VectorVest Simulator
- VectorVest Variator
- VectorVest Watchdog
