HOT TOPICS LIST
- MACD
- Fibonacci
- RSI
- Gann
- ADXR
- Stochastics
- Volume
- Triangles
- Futures
- Cycles
- Volatility
- ZIGZAG
- MESA
- Retracement
- Aroon
INDICATORS LIST
LIST OF TOPICS
PRINT THIS ARTICLE
by Billy Williams
Entry methods often have to be customized depending on the dynamics of the market, which can lead to more successful trades.
Position: Hold
Billy Williams
Billy Williams has been trading the markets for 27 years, specializing in momentum trading with stocks and options.
PRINT THIS ARTICLE
TECHNICAL INDICATORS
High/Low Entry Method For Trading Ranges
04/13/11 08:51:22 AMby Billy Williams
Entry methods often have to be customized depending on the dynamics of the market, which can lead to more successful trades.
Position: Hold
| In whatever market you trade -- forex, stock market, currencies, futures, metals, and so on -- the price action is always caught between two very different dynamics, contraction and expansion. Because markets move between these two dynamics, it can be difficult to enter into a buy or sell position because each has distinctive traits that force you to customize an entry approach by taking those traits into account. When price is in a period of contraction, price will contract within a narrow range as neither the bulls nor the bears appear able to take control of the price action and force into a trend. It is in these contracted ranges that the market may begin to form a congested trading range where support and resistance are easily identified. |
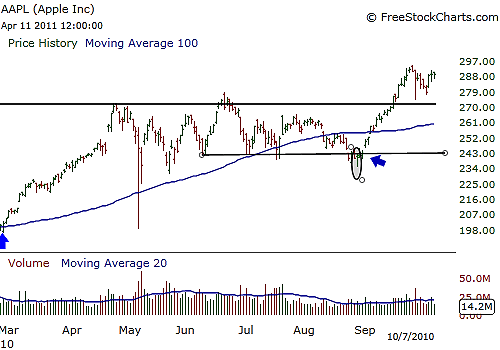
| Because price is caught between easily identified price levels, it's important to let price confirm the trade and signal your entry. For support levels, observe the daily price bar that touches the point in the price action where support has been identified and a significant price low is set by the daily price bar. When price reacts from this level after setting a new price low at support, this becomes the trade setup and an entry is confirmed by a high/low entry that closes over this day's price high. The following trading day or within four trading days, price will trade over the high of the daily price bar that set the low while closing over that day's price high. This lets the market confirm the entry by allowing price to react at the identified price support level, revealing the bulls taking control within this congested trading range and pushing price higher toward the resistance price level. See Figure 1. |

|
| FIGURE 1: AAPL. AAPL was trading within a contracted price range when it found support on August 27, 2010, and set a new low at that price level. Two trading days later, on August 31, 2011, that day's price bar closed over the high of August 27, 2011, and went higher from there. |
| Graphic provided by: www.freestockcharts.com. |
| |
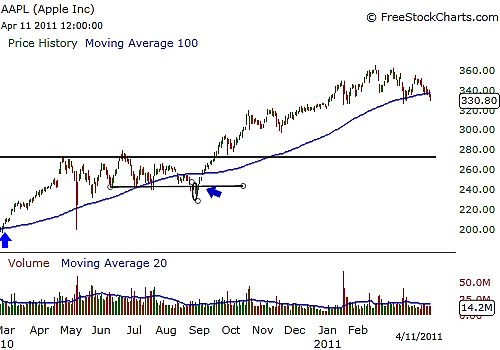
| Conversely, for resistance levels, watch for the daily price bar that approaches this identified level of price resistance and sets a new significant price high, marking that day's price low as the entry level for the trading day that closes under that price low. Once price reacts at this price resistance level the following trading day or within four trading days, price will confirm that the bears have taken control of the minor trend within the congested trading range once that day's price bar closes under the price low of the daily price bar that has set the significant price high at resistance. Of course, a powerful filter to use when trading these contracted ranges and using the high/how entry method are moving averages. A good moving average to use is the 100-day simple moving average (SMA), because it's not often watched by the majority of traders yet is a good indicator of intermediate level trends in place. |

|
| FIGURE 2: AAPL. Using the 100-day SMA, you can see that AAPL was in a bullish trend at the time of the entry, putting you on the side of the primary trend where AAPL went on to trade as much as 120 points from that initial support level. |
| Graphic provided by: www.freestockcharts.com. |
| |
| For quick trend recognition, note if the 100-day SMA is trading from the lower left-hand corner of your computer screen, moving toward the upper-right hand corner, then it is moving in a bullish trend. Therefore, you want to trade support levels with the high/low entry method to put the odds on your side by trading in the direction of the dominant trend. If the 100-day SMA is trading from the upper left-hand corner of your computer screen toward the lower right-hand corner of your computer screen, then price is in a bearish trend. In that case, you want to trade resistance levels while using the high/low entry method to put the odds on your side by also trading in the direction of the dominant trend. |
| By tailoring your approach toward entering within price contraction, you are adapting to a dynamic market that is moving from one point to another, from contraction to expansion. By having a solid approach to capitalize on these dynamic forces, you arm yourself with valuable tools to profit from trading ranges while also putting the odds on your side by playing to the dominant trend's strength at each particular moment. |
Billy Williams has been trading the markets for 27 years, specializing in momentum trading with stocks and options.
| Company: | StockOptionSystem.com |
| E-mail address: | stockoptionsystem.com@gmail.com |
Traders' Resource Links | |
| StockOptionSystem.com has not added any product or service information to TRADERS' RESOURCE. | |
Click here for more information about our publications!
PRINT THIS ARTICLE

|

Request Information From Our Sponsors
- StockCharts.com, Inc.
- Candle Patterns
- Candlestick Charting Explained
- Intermarket Technical Analysis
- John Murphy on Chart Analysis
- John Murphy's Chart Pattern Recognition
- John Murphy's Market Message
- MurphyExplainsMarketAnalysis-Intermarket Analysis
- MurphyExplainsMarketAnalysis-Visual Analysis
- StockCharts.com
- Technical Analysis of the Financial Markets
- The Visual Investor
- VectorVest, Inc.
- Executive Premier Workshop
- One-Day Options Course
- OptionsPro
- Retirement Income Workshop
- Sure-Fire Trading Systems (VectorVest, Inc.)
- Trading as a Business Workshop
- VectorVest 7 EOD
- VectorVest 7 RealTime/IntraDay
- VectorVest AutoTester
- VectorVest Educational Services
- VectorVest OnLine
- VectorVest Options Analyzer
- VectorVest ProGraphics v6.0
- VectorVest ProTrader 7
- VectorVest RealTime Derby Tool
- VectorVest Simulator
- VectorVest Variator
- VectorVest Watchdog
