HOT TOPICS LIST
- MACD
- Fibonacci
- RSI
- Gann
- ADXR
- Stochastics
- Volume
- Triangles
- Futures
- Cycles
- Volatility
- ZIGZAG
- MESA
- Retracement
- Aroon
INDICATORS LIST
LIST OF TOPICS
PRINT THIS ARTICLE
by Austin Passamonte
Here's a midterm view of Standard & Poor's 500 (ES) and Russell 2000 (TF) index futures.
Position: N/A
Austin Passamonte
Austin is a private trader who trades emini stock index futures intraday. He currently trades various futures markets from home in addition to managing a trader's educational forum
PRINT THIS ARTICLE
TECHNICAL ANALYSIS
Southbound & Down?
04/12/11 10:05:14 AMby Austin Passamonte
Here's a midterm view of Standard & Poor's 500 (ES) and Russell 2000 (TF) index futures.
Position: N/A
| For the past few weeks, we've plotted emini charts and made note of key action points along the way. Recent multiday price consolidation at prior swing highs has begun to roll lower. Is this merely the latest pullback before the upward ascent continues? Or is it a sustained campaign south on the charts? |

|
| FIGURE 1: ES, DAILY |
| Graphic provided by: NinjaTrader. |
| |
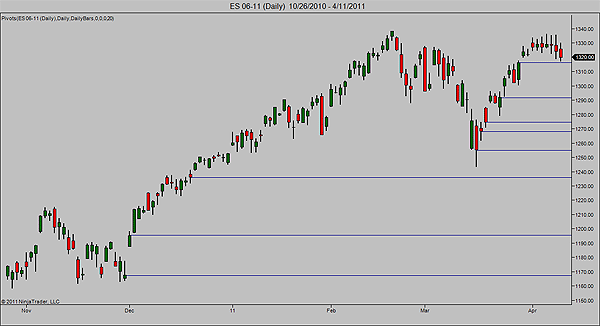
| Even after a couple of nearby gaps were recently filled in ES, a ton of open windows still remain below current resting price. We can be sure that all of these gaps will eventually be filled, sooner or later. Whether that happens straight from here -- sooner or some now and others later -- remains to be seen. But holding open short trades to gap fills if price goes sequentially lower gives you structured price objectives that you can target. See Figure 1. |

|
| FIGURE 2: ES, DAILY |
| Graphic provided by: NinjaTrader. |
| |
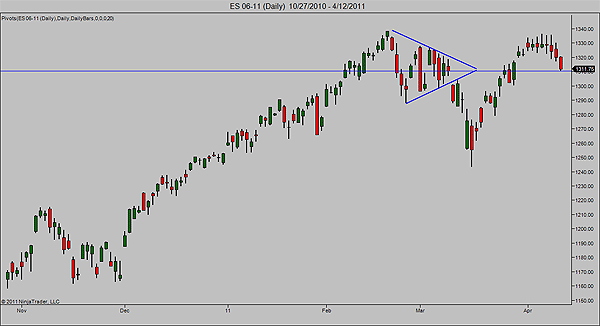
| That prior wedge pattern that broke lower on volume lifted back up on lighter volume now pulled back to the apex magnet again. A bounce from there upward would indicate support has held and rally continues to bleed higher. A break & close below signals support has turned to resistance and lower levels are highly probable from there. See Figure 2. |

|
| FIGURE 3: TF, DAILY |
| Graphic provided by: NinjaTrader. |
| |
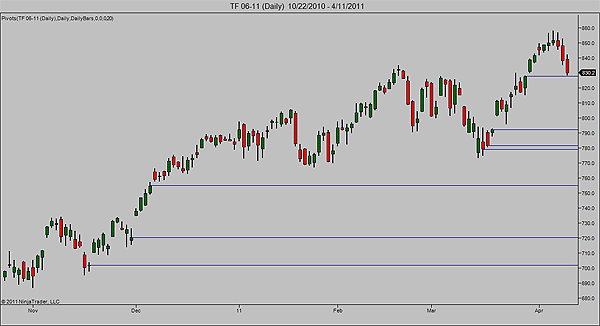
| Same story, different symbol. Russell 2000 emini futures have led the decline and eye numerous open gaps below, as do the S&P futures. This many gaps clustered in such a relatively narrow price zone never remain open forever. See Figure 3. |

|
| FIGURE 4: TF, DAILY |
| Graphic provided by: NinjaTrader. |
| |
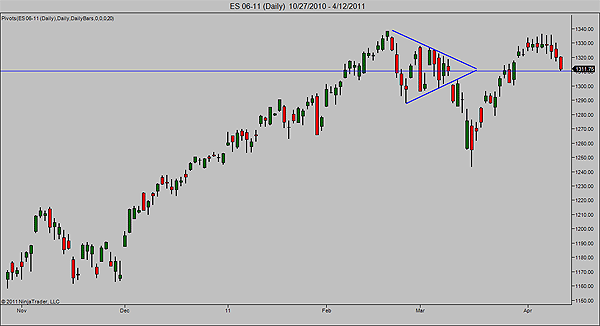
| Also keeping a technical eye on the same wedge formation's apex point (Figure 4), TF 815 is a pivotal magnet to measure pending price action. Bounce off = uptrend intact, break below = change in travel plans for emini index markets. |
Austin is a private trader who trades emini stock index futures intraday. He currently trades various futures markets from home in addition to managing a trader's educational forum
| Title: | Individual Trader |
| Company: | CoiledMarkets.com |
| Address: | PO Box 633 |
| Naples, NY 14512 | |
| Website: | coiledmarkets.com/blog |
| E-mail address: | austinp44@yahoo.com |
Traders' Resource Links | |
| CoiledMarkets.com has not added any product or service information to TRADERS' RESOURCE. | |
Click here for more information about our publications!
PRINT THIS ARTICLE

Request Information From Our Sponsors
- StockCharts.com, Inc.
- Candle Patterns
- Candlestick Charting Explained
- Intermarket Technical Analysis
- John Murphy on Chart Analysis
- John Murphy's Chart Pattern Recognition
- John Murphy's Market Message
- MurphyExplainsMarketAnalysis-Intermarket Analysis
- MurphyExplainsMarketAnalysis-Visual Analysis
- StockCharts.com
- Technical Analysis of the Financial Markets
- The Visual Investor
- VectorVest, Inc.
- Executive Premier Workshop
- One-Day Options Course
- OptionsPro
- Retirement Income Workshop
- Sure-Fire Trading Systems (VectorVest, Inc.)
- Trading as a Business Workshop
- VectorVest 7 EOD
- VectorVest 7 RealTime/IntraDay
- VectorVest AutoTester
- VectorVest Educational Services
- VectorVest OnLine
- VectorVest Options Analyzer
- VectorVest ProGraphics v6.0
- VectorVest ProTrader 7
- VectorVest RealTime Derby Tool
- VectorVest Simulator
- VectorVest Variator
- VectorVest Watchdog
