HOT TOPICS LIST
- MACD
- Fibonacci
- RSI
- Gann
- ADXR
- Stochastics
- Volume
- Triangles
- Futures
- Cycles
- Volatility
- ZIGZAG
- MESA
- Retracement
- Aroon
INDICATORS LIST
LIST OF TOPICS
PRINT THIS ARTICLE
by Andrew Hetherington
The previously invincible home improvement behemoth Home Depot (HD) is ready to drop in spite of a strong housing market. Is this a contradiction or a sign of things to come?
Position: N/A
Andrew Hetherington
Classic Dow Theorist who trades as a pure technician, using pattern recognition.
PRINT THIS ARTICLE
ASCENDING TRIANGLES
The Hammer is About to Fall at Home Depot
03/04/02 12:40:49 PMby Andrew Hetherington
The previously invincible home improvement behemoth Home Depot (HD) is ready to drop in spite of a strong housing market. Is this a contradiction or a sign of things to come?
Position: N/A
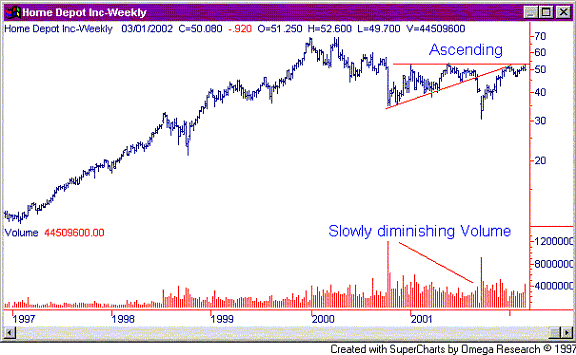
| After two decades of growth in its equity price Home Depot showed cracks in its armor in 2000. It was similar to many Dow components, showing sideways movement over this period from 1999 - 2001 while the Dow formed a broadening top. |
| There was warning of the trouble ahead when a large ascending triangle formed between October 2000 and August 2001. This triangle, which is typically bullish, broke to the downside with zest on August 30, 2001. The volume increased on the downside break to 8.3 million shares-- slightly higher than recent activity. |

|
| Figure 1: Weekly chart for HD. |
| Graphic provided by: SuperCharts. |
| |
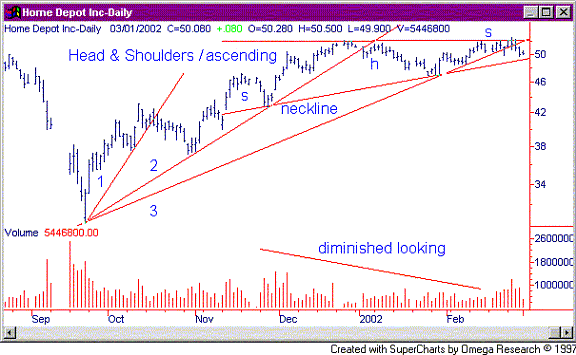
| In Figure 2 we see a hard drop after the break on the downside, which finally bottomed out at $30.30 on September 21, 2001 at the 1998 support level. It has retraced as high as $52.60 on February 26, 2002 after climbing for almost six months. Now the party is over. A four-month ascending triangle or head and shoulders has formed with good volume on the creation of the pattern. Either pattern is correct since they both meet all the necessary criteria. The downside break is at the $49.40 area on the neckline or the trend line. The anticipated downside move will go to the $42.00 area and perhaps even the $38.00 support if it gets ugly. In addition to these patterns there has also been a third fan line break on Wednesday February 27, 2002 indicating a change in its short-term direction. |
 Figure 2: Daily chart for HD. If you were in Home Depot for the short to medium term then it is a good time to lock in profits and prepare to accumulate shares at the lower levels. These lower level supports will be good entry points for taking long positions. On the other hand, it is also a good time to take a short position and ride it down to those supports before switching gears to go long. Times ahead look worrisome for Home Depot in the short term. |
Classic Dow Theorist who trades as a pure technician, using pattern recognition.
| Toronto, Canada |
Click here for more information about our publications!
Comments
Date: 03/04/02Rank: 4Comment:
Date: 03/05/02Rank: 5Comment:
Date: 03/06/02Rank: 5Comment:
Date: 03/06/02Rank: 4Comment:
Date: 03/12/02Rank: 1Comment: You Suck
Date: 03/13/02Rank: 5Comment:
Date: 03/13/02Rank: 5Comment:
Date: 03/14/02Rank: 5Comment:
Date: 03/18/02Rank: 3Comment:
Date: 03/19/02Rank: 5Comment:

Request Information From Our Sponsors
- StockCharts.com, Inc.
- Candle Patterns
- Candlestick Charting Explained
- Intermarket Technical Analysis
- John Murphy on Chart Analysis
- John Murphy's Chart Pattern Recognition
- John Murphy's Market Message
- MurphyExplainsMarketAnalysis-Intermarket Analysis
- MurphyExplainsMarketAnalysis-Visual Analysis
- StockCharts.com
- Technical Analysis of the Financial Markets
- The Visual Investor
- VectorVest, Inc.
- Executive Premier Workshop
- One-Day Options Course
- OptionsPro
- Retirement Income Workshop
- Sure-Fire Trading Systems (VectorVest, Inc.)
- Trading as a Business Workshop
- VectorVest 7 EOD
- VectorVest 7 RealTime/IntraDay
- VectorVest AutoTester
- VectorVest Educational Services
- VectorVest OnLine
- VectorVest Options Analyzer
- VectorVest ProGraphics v6.0
- VectorVest ProTrader 7
- VectorVest RealTime Derby Tool
- VectorVest Simulator
- VectorVest Variator
- VectorVest Watchdog
