HOT TOPICS LIST
- MACD
- Fibonacci
- RSI
- Gann
- ADXR
- Stochastics
- Volume
- Triangles
- Futures
- Cycles
- Volatility
- ZIGZAG
- MESA
- Retracement
- Aroon
INDICATORS LIST
LIST OF TOPICS
PRINT THIS ARTICLE
by Koos van der Merwe
I am a fan of natural gas. I believe it is a by-product of decay, and that there is plenty around. The world is looking for a cheap energy source, and here it is.
Position: Buy
Koos van der Merwe
Has been a technical analyst since 1969, and has worked as a futures and options trader with First Financial Futures in Johannesburg, South Africa.
PRINT THIS ARTICLE
STRATEGIES
The Williams Companies Income
04/11/11 01:10:42 PMby Koos van der Merwe
I am a fan of natural gas. I believe it is a by-product of decay, and that there is plenty around. The world is looking for a cheap energy source, and here it is.
Position: Buy
| A golf course I play on in Vancouver, British Columbia, Canada, has been built on a refuse dump. The course is a beautiful one, well cared for with immaculate fairways and greens. However, when it rains, and puddles of water form on the fairways, one always sees bubbles of natural gas exploding to the surface. The Williams Cos. (WMB) is making natural gas development a reality every day. They work to produce the natural gas that the nation needs by specializing in developing unconventional reserves, including tight-sands gas, coal-bed methane, and shale. Today, they produce enough natural gas to meet the energy needs of five million homes per day. |

|
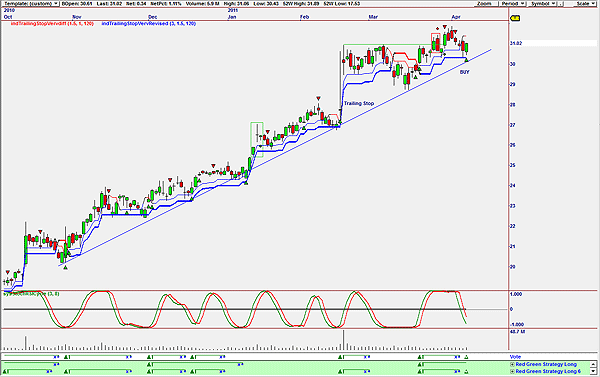
| FIGURE 1: WMB, DAILY. Here's a chart showing a buy signal. |
| Graphic provided by: OmniTrader. |
| |
| Figure 1 uses the red/green strategy to determine buy and sell signals. The strategy is a simple one. Buy signals (green) are given when the closing price breaks above the high of 10 days ago. Sell signals (red) are given when the closing price breaks below the low of six days ago. The OmniTrader program does, however, allow one to adapt the strategy to one's preferences, as shown in Figure 2. The chart shows that the strategy is currently suggesting a buy. Note how the previous buy signals given were accurate, and the share price rising. Note also how the stochastic RSI (relative strength index) cycle indicator suggested a sell signal, not confirmed by a break below the trailing stop. |

|
| FIGURE 2: STRATEGY FORMULA |
| Graphic provided by: OmniTrader. |
| |
| Do note how the strategy plan takes the trailing stop into consideration. |

|
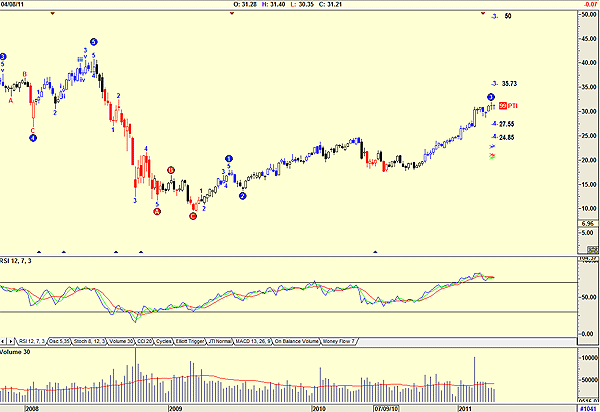
| FIGURE 3: WMB, WEEKLY |
| Graphic provided by: AdvancedGET. |
| |
| Figure 3 is a weekly chart using the Advanced GET program, suggesting that a correction is due possibly to test the 27.55 or 24.85 level in a wave 4 correction. Do note that the PTI (the probability index) is 99% and that there is a possibility that the share price could rise to $35.73 or $50. This rise could occur as suggested by the RSI, which has not yet given a sell signal, even though it is at overbought levels. Note also that volume is below average as the price rose, a sign of weakness. I would be a buyer of WMB shares, but with close stops because of the weekly chart. |
Has been a technical analyst since 1969, and has worked as a futures and options trader with First Financial Futures in Johannesburg, South Africa.
| Address: | 3256 West 24th Ave |
| Vancouver, BC | |
| Phone # for sales: | 6042634214 |
| E-mail address: | petroosp@gmail.com |
Click here for more information about our publications!
PRINT THIS ARTICLE

Request Information From Our Sponsors
- StockCharts.com, Inc.
- Candle Patterns
- Candlestick Charting Explained
- Intermarket Technical Analysis
- John Murphy on Chart Analysis
- John Murphy's Chart Pattern Recognition
- John Murphy's Market Message
- MurphyExplainsMarketAnalysis-Intermarket Analysis
- MurphyExplainsMarketAnalysis-Visual Analysis
- StockCharts.com
- Technical Analysis of the Financial Markets
- The Visual Investor
- VectorVest, Inc.
- Executive Premier Workshop
- One-Day Options Course
- OptionsPro
- Retirement Income Workshop
- Sure-Fire Trading Systems (VectorVest, Inc.)
- Trading as a Business Workshop
- VectorVest 7 EOD
- VectorVest 7 RealTime/IntraDay
- VectorVest AutoTester
- VectorVest Educational Services
- VectorVest OnLine
- VectorVest Options Analyzer
- VectorVest ProGraphics v6.0
- VectorVest ProTrader 7
- VectorVest RealTime Derby Tool
- VectorVest Simulator
- VectorVest Variator
- VectorVest Watchdog
