HOT TOPICS LIST
- MACD
- Fibonacci
- RSI
- Gann
- ADXR
- Stochastics
- Volume
- Triangles
- Futures
- Cycles
- Volatility
- ZIGZAG
- MESA
- Retracement
- Aroon
INDICATORS LIST
LIST OF TOPICS
PRINT THIS ARTICLE
by Donald W. Pendergast, Jr.
After a shock selloff in a stock, there is usually a minor rebound, which is frequently followed by a secondary selloff down to retest the initial low. Shares of Entergy may be about to embark on that ride to a retest -- and soon.
Position: Sell
Donald W. Pendergast, Jr.
Donald W. Pendergast is a financial markets consultant who offers specialized services to stock brokers and high net worth individuals who seek a better bottom line for their portfolios.
PRINT THIS ARTICLE
TRADING SYSTEMS
Entergy Shows Weak Relative Strength And Strong Sell Signal
04/08/11 08:22:25 AMby Donald W. Pendergast, Jr.
After a shock selloff in a stock, there is usually a minor rebound, which is frequently followed by a secondary selloff down to retest the initial low. Shares of Entergy may be about to embark on that ride to a retest -- and soon.
Position: Sell
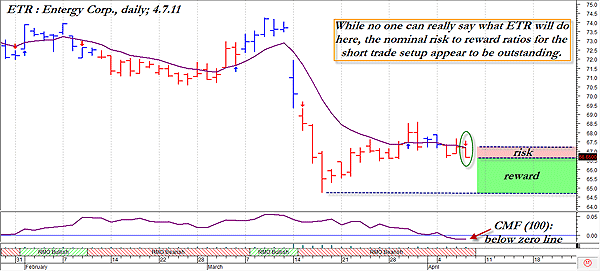
| Although I favor trading systems without the use of other discretionary factors, the fact remains that for some traders the combined use of a mechanical system signal in conjunction with various fundamental, seasonal or technical tools remains a viable and frequently profitable way to trade. Here's a look at an outstanding mechanical Rahul Mohindar (RMO) swing sell signal in Entergy (ETR), one that arrives at a critical and potentially profitable technical juncture on its daily chart (Figure 1). |

|
| FIGURE 1: ETR, DAILY. When a proven trading system's signal is generated in the context of other compelling chart and/or broad market dynamics, some traders will gain the extra confidence needed to actually take the trade. |
| Graphic provided by: MetaStock. |
| Graphic provided by: Rahul Mohindar RMO indicators from MetaStock 11. |
| |
| ETR has already endured a shock selloff and also appeared to have completed a proportional retracement in its aftermath. With the .SPX also at or very near an interim cycle high (daily chart basis) and the fact that ETR has the worst 13-week relative strength ranking versus the .SPX -- even as a fresh RMO sell signal fires -- this trade setup is sure to catch the eye of more than one prospective short seller. To put the icing on the cake, the stock's 100-period Chaikin money flow (CMF)(100) is also below its zero line, apparently offering a decent, low-risk short trade setup. |
| Here's a numerical description of the risk/reward bias of this trade, which is nothing less than outstanding: 67.22 buy-stop: To cover at a loss if wrong 66.60 sell-stop: To initiate the position 64.72 initial profit target: Take the money and run (if reached) In addition, you'll also want to run either a two- or three-bar trailing stop of the daily highs if the stock starts to drop as anticipated. Even if the profit target isn't reached, such a trailing stop can help you lock in at least a bit of profit and/or help further reduce the initial risk on the trade. Simply put, the potential reward is $1.82 per share and the initial risk is $0.62 per share, which equates to a risk/reward of nearly three to one. For a daily short setup, this is exceptionally good, and if you've already had some success at making money on the short side of the market, be sure to take a close look at this trade and do a little more confirmation work to ascertain for yourself that this really is a low-risk trading opportunity. |
Donald W. Pendergast is a financial markets consultant who offers specialized services to stock brokers and high net worth individuals who seek a better bottom line for their portfolios.
| Title: | Writer, market consultant |
| Company: | Linear Trading Systems LLC |
| Jacksonville, FL 32217 | |
| Phone # for sales: | 904-239-9564 |
| E-mail address: | lineartradingsys@gmail.com |
Traders' Resource Links | |
| Linear Trading Systems LLC has not added any product or service information to TRADERS' RESOURCE. | |
Click here for more information about our publications!
Comments
Date: 04/12/11Rank: 4Comment:

|

Request Information From Our Sponsors
- StockCharts.com, Inc.
- Candle Patterns
- Candlestick Charting Explained
- Intermarket Technical Analysis
- John Murphy on Chart Analysis
- John Murphy's Chart Pattern Recognition
- John Murphy's Market Message
- MurphyExplainsMarketAnalysis-Intermarket Analysis
- MurphyExplainsMarketAnalysis-Visual Analysis
- StockCharts.com
- Technical Analysis of the Financial Markets
- The Visual Investor
- VectorVest, Inc.
- Executive Premier Workshop
- One-Day Options Course
- OptionsPro
- Retirement Income Workshop
- Sure-Fire Trading Systems (VectorVest, Inc.)
- Trading as a Business Workshop
- VectorVest 7 EOD
- VectorVest 7 RealTime/IntraDay
- VectorVest AutoTester
- VectorVest Educational Services
- VectorVest OnLine
- VectorVest Options Analyzer
- VectorVest ProGraphics v6.0
- VectorVest ProTrader 7
- VectorVest RealTime Derby Tool
- VectorVest Simulator
- VectorVest Variator
- VectorVest Watchdog
