HOT TOPICS LIST
- MACD
- Fibonacci
- RSI
- Gann
- ADXR
- Stochastics
- Volume
- Triangles
- Futures
- Cycles
- Volatility
- ZIGZAG
- MESA
- Retracement
- Aroon
INDICATORS LIST
LIST OF TOPICS
PRINT THIS ARTICLE
by Koos van der Merwe
I am a firm believer in the first rule of the Elliott wave theory, that the chart must look right.
Position: Accumulate
Koos van der Merwe
Has been a technical analyst since 1969, and has worked as a futures and options trader with First Financial Futures in Johannesburg, South Africa.
PRINT THIS ARTICLE
ELLIOTT WAVE
Why Are There Bears Out There?
04/06/11 11:10:04 AMby Koos van der Merwe
I am a firm believer in the first rule of the Elliott wave theory, that the chart must look right.
Position: Accumulate
| When I listen to all the bears out there, I can understand why they exist. They are looking at an Elliott wave chart of the Dow Jones Industrial Average (DJIA). The DJIA is an index made up of 30 of the best-performing companies on the New York Stock Exchange. History, however, has taught me that when a market recovers from a major low, it is always the small caps that lead the way, with the heavyweights following. This is one reason why I struggle to be a bear. I look at the Standard & Poor's 500 for my guide, even the Russell 2000 or 3000 if I am in any doubt. So let us examine all the indexes. |

|
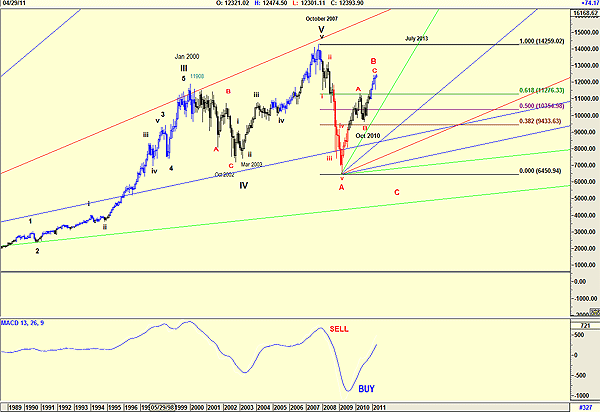
| FIGURE 1: DJIA, MONTHLY |
| Graphic provided by: AdvancedGET. |
| |
| Figure 1, a monthly chart of the DJIA, suggests that the DJIA topped out with a wave V in October 2007. Wave theory suggests that there should be an ABC retracement. The chart suggests that wave A is complete, and the DJIA is now in a wave B upward, in the process of tracing a wave C of wave B. Wave Bs have been known to retrace as high as the wave V top, so we could see it testing the 14259 high of wave V. A Gann fan is looking for the top of wave B to be reached in July 2013. Do note that the moving average convergence/divergence (MACD) oscillator is bullish. Note that the chart looks right. |

|
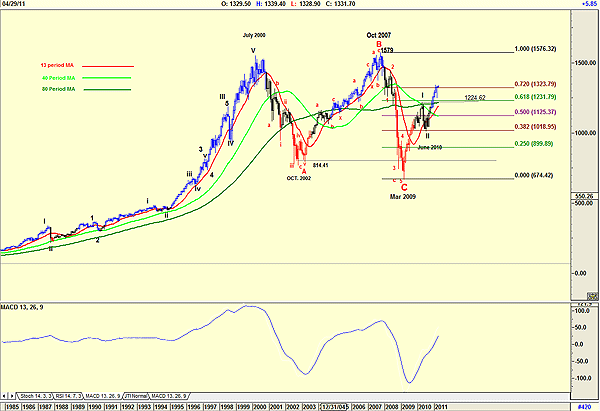
| FIGURE 2: S&P 500, MONTHLY |
| Graphic provided by: AdvancedGET. |
| |
| The S&P 500 monthly chart shown in Figure 2 suggests a completely different picture. The chart suggests that the wave V high was completed in July 2000, and that since then, an ABC correction completed itself in March 2009 -- that the index has completed waves 1 and 2 of a new bull market, and is currently in a wave 3. |

|
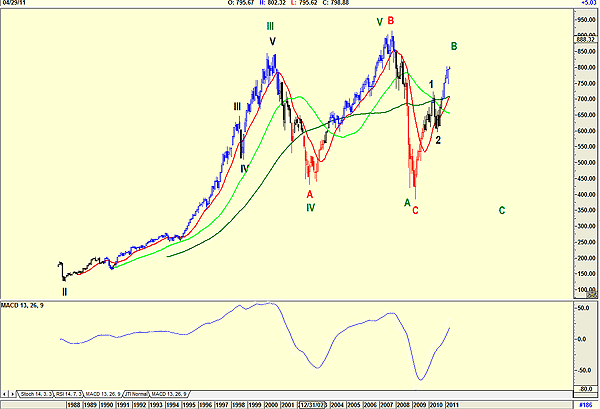
| FIGURE 3: RUSSELL 3000, MONTHLY |
| Graphic provided by: AdvancedGET. |
| |
| Of course, the Russell 3000 index must look similar to the S&P 500 index, and it does, as shown in Figure 3. However, with wave B being a great deal higher than wave V, one can think of an alternative count, as I have shown on the chart in green. This, like the DJIA, suggests that the index is in a B-wave with a C-wave still to come. The reason I reject this count is because of the first rule of Elliott wave theory: The chart must look right. The alternate (green) count suggests that wave IV has retraced beyond the fourth wave of lesser degree. Do remember, a wave II retracement can be as much as a 72% retracement and I have even seen a 100% retracement. A wave IV is, however, restricted. Who will be correct in their wave count? Only time will tell, but one must go with the flow, and the current at the moment is bull. |
Has been a technical analyst since 1969, and has worked as a futures and options trader with First Financial Futures in Johannesburg, South Africa.
| Address: | 3256 West 24th Ave |
| Vancouver, BC | |
| Phone # for sales: | 6042634214 |
| E-mail address: | petroosp@gmail.com |
Click here for more information about our publications!
Comments
Date: 04/07/11Rank: 5Comment:

Request Information From Our Sponsors
- StockCharts.com, Inc.
- Candle Patterns
- Candlestick Charting Explained
- Intermarket Technical Analysis
- John Murphy on Chart Analysis
- John Murphy's Chart Pattern Recognition
- John Murphy's Market Message
- MurphyExplainsMarketAnalysis-Intermarket Analysis
- MurphyExplainsMarketAnalysis-Visual Analysis
- StockCharts.com
- Technical Analysis of the Financial Markets
- The Visual Investor
- VectorVest, Inc.
- Executive Premier Workshop
- One-Day Options Course
- OptionsPro
- Retirement Income Workshop
- Sure-Fire Trading Systems (VectorVest, Inc.)
- Trading as a Business Workshop
- VectorVest 7 EOD
- VectorVest 7 RealTime/IntraDay
- VectorVest AutoTester
- VectorVest Educational Services
- VectorVest OnLine
- VectorVest Options Analyzer
- VectorVest ProGraphics v6.0
- VectorVest ProTrader 7
- VectorVest RealTime Derby Tool
- VectorVest Simulator
- VectorVest Variator
- VectorVest Watchdog
