HOT TOPICS LIST
- MACD
- Fibonacci
- RSI
- Gann
- ADXR
- Stochastics
- Volume
- Triangles
- Futures
- Cycles
- Volatility
- ZIGZAG
- MESA
- Retracement
- Aroon
INDICATORS LIST
LIST OF TOPICS
PRINT THIS ARTICLE
by Andrew Hetherington
With a rising wedge formation forming on the chart for Krispy Kreme doughnuts, the stock could be in for a downward move.
Position: N/A
Andrew Hetherington
Classic Dow Theorist who trades as a pure technician, using pattern recognition.
PRINT THIS ARTICLE
WEDGE FORMATIONS
The Rising Wedge of Worry!
03/01/02 01:18:32 PMby Andrew Hetherington
With a rising wedge formation forming on the chart for Krispy Kreme doughnuts, the stock could be in for a downward move.
Position: N/A
| Over the past two years some traders have lost money shorting Krispy Kreme doughnuts (KKD). On a non-technical basis they are the best doughnuts that I have ever tasted. They opened up their first doughnut shop in Toronto recently and I am very impressed even though you can expect to wait up to a half hour to get your doughnuts. However, the equity could see some trouble ahead. |
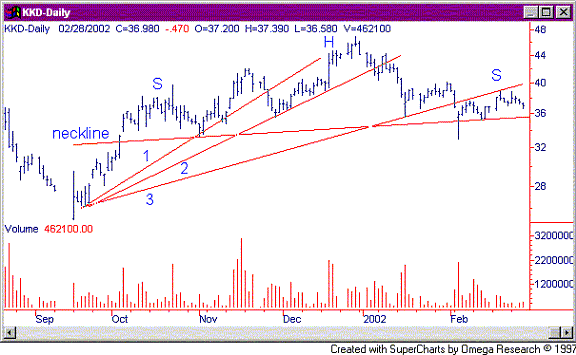
| In figure 1 we see a small 5-month head and shoulders pattern with good volume on the creation of the pattern. This situation has slightly lower volume on the left shoulder than on the head. I prefer the spiking volume to be on the left shoulder but in this scenario I've looked beyond this flaw. |

|
| Figure 1: Daily chart for Krispy Kreme doughnuts (KKD) showing the most recent head and shoulders pattern. |
| Graphic provided by: SuperCharts. |
| |
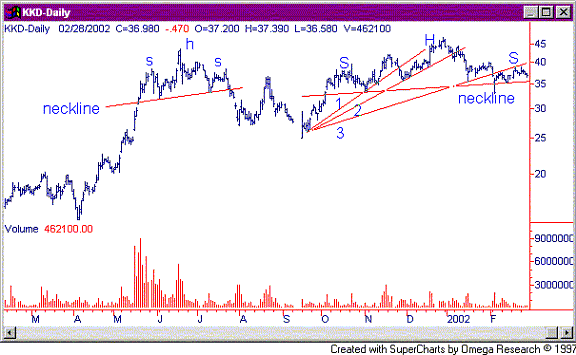
| It broke the third fan line 18 days ago on February 4, 2002 and has had a pullback to the line in the $38.00 area. The right shoulder is almost completed and the third fan line has given us an early indication of the ID (impending doom) to come. The neckline for the head and shoulders pattern is in the $35.60 area. An initial drop to the $30.50 area is on the horizon. A similar head and shoulders pattern was created back in May to July of 2001. Figure 2 illustrates the only two times this chart should be played short. |
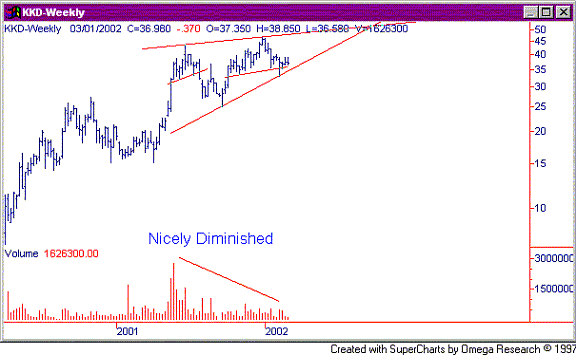
 Figure 2: Daily chart for KKD outlining the 2 most recent head and shoulders patterns. On the bigger picture we see a much bigger bearish pattern at work (rising wedge), shown in the weekly chart below (Figure 3). It's still a little early since this pattern is not completed yet. However, given the bearish head and shoulders pattern that is ready to go south any day, we must consider that the bigger wall of worry will also be completed. This suggests that a hard drop from the bottom line on the wedge in the $34.50 area will have a significant impact on the equity price. An initial target price from this much larger pattern is likely to be in the $27.00 area. That's a nice discounted price if you want to accumulate this equity. In fact, if the market direction changes and the equity moves up after it hits $27.00 I would suggest this as a good accumulation point. I must caution those interested that these patterns are not completed yet. There is an increased risk when you play within the pattern but the potential rewards are also greater. |
 Figure 3: Weekly chart for KKD outlining the developing rising wedge pattern. |
Classic Dow Theorist who trades as a pure technician, using pattern recognition.
| Toronto, Canada |
Click here for more information about our publications!
Comments
Date: 03/08/02Rank: 5Comment:
Date: 03/11/02Rank: 4Comment:
Date: 03/12/02Rank: 4Comment: good long and medium term technicals
Date: 03/12/02Rank: 4Comment:

Request Information From Our Sponsors
- StockCharts.com, Inc.
- Candle Patterns
- Candlestick Charting Explained
- Intermarket Technical Analysis
- John Murphy on Chart Analysis
- John Murphy's Chart Pattern Recognition
- John Murphy's Market Message
- MurphyExplainsMarketAnalysis-Intermarket Analysis
- MurphyExplainsMarketAnalysis-Visual Analysis
- StockCharts.com
- Technical Analysis of the Financial Markets
- The Visual Investor
- VectorVest, Inc.
- Executive Premier Workshop
- One-Day Options Course
- OptionsPro
- Retirement Income Workshop
- Sure-Fire Trading Systems (VectorVest, Inc.)
- Trading as a Business Workshop
- VectorVest 7 EOD
- VectorVest 7 RealTime/IntraDay
- VectorVest AutoTester
- VectorVest Educational Services
- VectorVest OnLine
- VectorVest Options Analyzer
- VectorVest ProGraphics v6.0
- VectorVest ProTrader 7
- VectorVest RealTime Derby Tool
- VectorVest Simulator
- VectorVest Variator
- VectorVest Watchdog
