

HOT TOPICS LIST
- MACD
- Fibonacci
- RSI
- Gann
- ADXR
- Stochastics
- Volume
- Triangles
- Futures
- Cycles
- Volatility
- ZIGZAG
- MESA
- Retracement
- Aroon
INDICATORS LIST
LIST OF TOPICS
PRINT THIS ARTICLE
by Austin Passamonte
Here's the near-term price outlook for S&P 500 index futures.
Position: N/A
Austin Passamonte
Austin is a private trader who trades emini stock index futures intraday. He currently trades various futures markets from home in addition to managing a trader's educational forum
PRINT THIS ARTICLE
TECHNICAL ANALYSIS
Holey Macro
04/04/11 11:43:06 AMby Austin Passamonte
Here's the near-term price outlook for S&P 500 index futures.
Position: N/A
| Left unfettered to operate within a normal, free enterprise environment, financial markets move through their usual course of low to high or high to low in deliberate fashion. They tend to pause, form a consolidation, or base at certain price levels, and then proceed to repeat the process higher or lower from there. What we have not seen in many months (if not years now) are unfettered financial markets related to anything about the US debt. |
|
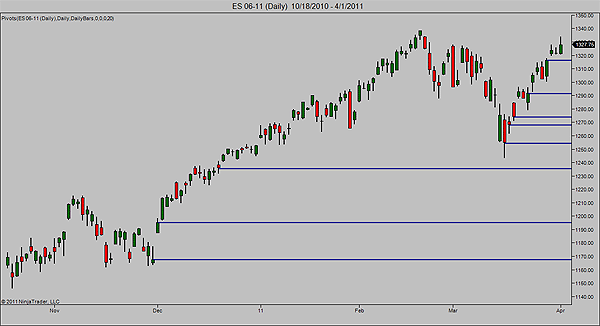
| FIGURE 1: S&P 500 FUTURES (ES), DAILY |
| Graphic provided by: NinjaTrader. |
| |
| The Standard & Poor's 500 (ES) futures filled a couple of gaps from January 2011 on their way to recent swing lows in March. From there is was yet another overnight gap = low-volume hopscotch higher once more. Going back just 13 sessions from the time of this writing, we see no fewer than five (5) open gaps left behind (navy blue trendlines) in addition to at least three (3) historical gaps from late December 2010 onward. I do not recall another period in time where so many gaps are left unfilled in low-volume, low-volatility conditions. |
|
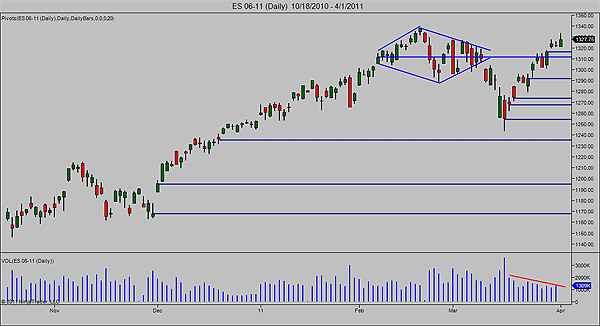
| FIGURE 2: S&P 500 FUTURES (ES), DAILY |
| Graphic provided by: NinjaTrader. |
| |
| Speaking of low-volume conditions, it's also obvious at a glance where the descending trendline (red) across volume that this recent levitation follows suit from all those prior: several days of upward drift have little participation behind them. Even though this results in a continual upward ascent, the corrections tend to come in violent, large-range pullbacks where volume accelerates. |
| The February to March diamond pattern near recent multiyear highs is usually a bearish omen. Prices did break down briefly, and of course, v-turned straight upward soon afterward. The midline of that pattern appears to magnetize near ES 1312 and should be gauged as a potential tipping point when tested next. |
| It is inevitable that those gaps below will eventually fill. What remains unknown to all is when those eventual peaks hit their highs. As we've learned over these past two years since market lows, price can be pushed higher from beneath our waning volume for extended periods of time. It is not our job to fade our direction or trends. It is our job to monitor charts, mark the waypoints where support and resistance form, and remain vigilant for the next energized price movement to come. |
Austin is a private trader who trades emini stock index futures intraday. He currently trades various futures markets from home in addition to managing a trader's educational forum
| Title: | Individual Trader |
| Company: | CoiledMarkets.com |
| Address: | PO Box 633 |
| Naples, NY 14512 | |
| Website: | coiledmarkets.com/blog |
| E-mail address: | austinp44@yahoo.com |
Traders' Resource Links | |
| CoiledMarkets.com has not added any product or service information to TRADERS' RESOURCE. | |
Click here for more information about our publications!
Comments
Date:�04/04/11Rank:�5Comment:�

Request Information From Our Sponsors
- StockCharts.com, Inc.
- Candle Patterns
- Candlestick Charting Explained
- Intermarket Technical Analysis
- John Murphy on Chart Analysis
- John Murphy's Chart Pattern Recognition
- John Murphy's Market Message
- MurphyExplainsMarketAnalysis-Intermarket Analysis
- MurphyExplainsMarketAnalysis-Visual Analysis
- StockCharts.com
- Technical Analysis of the Financial Markets
- The Visual Investor
- VectorVest, Inc.
- Executive Premier Workshop
- One-Day Options Course
- OptionsPro
- Retirement Income Workshop
- Sure-Fire Trading Systems (VectorVest, Inc.)
- Trading as a Business Workshop
- VectorVest 7 EOD
- VectorVest 7 RealTime/IntraDay
- VectorVest AutoTester
- VectorVest Educational Services
- VectorVest OnLine
- VectorVest Options Analyzer
- VectorVest ProGraphics v6.0
- VectorVest ProTrader 7
- VectorVest RealTime Derby Tool
- VectorVest Simulator
- VectorVest Variator
- VectorVest Watchdog