HOT TOPICS LIST
- MACD
- Fibonacci
- RSI
- Gann
- ADXR
- Stochastics
- Volume
- Triangles
- Futures
- Cycles
- Volatility
- ZIGZAG
- MESA
- Retracement
- Aroon
INDICATORS LIST
LIST OF TOPICS
PRINT THIS ARTICLE
by Chaitali Mohile
Pfizer has been underperforming for many years. But now there are signs the stock could see a bullish makeover.
Position: N/A
Chaitali Mohile
Active trader in the Indian stock markets since 2003 and a full-time writer. Trading is largely based upon technical analysis.
PRINT THIS ARTICLE
TECHNICAL INDICATORS
Pfizer In Fresh Uptrend?
04/01/11 10:32:02 AMby Chaitali Mohile
Pfizer has been underperforming for many years. But now there are signs the stock could see a bullish makeover.
Position: N/A
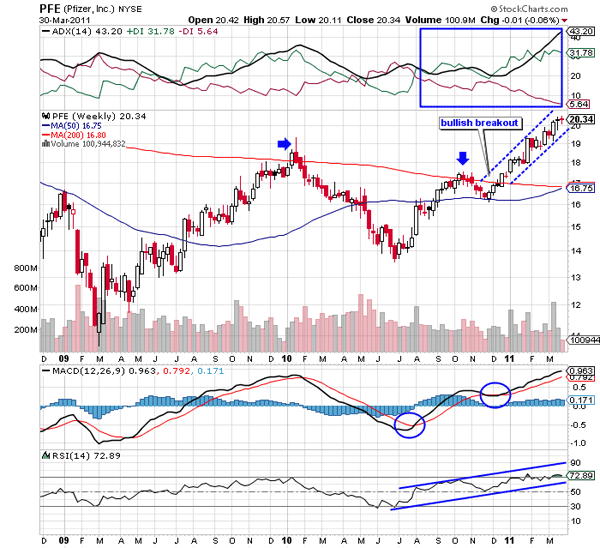
| According to the weekly chart in Figure 1, Pfizer, Inc. (PFE), was under bearish pressure in 2009-10. The descending 200-day moving average (MA) acted as resistance. The price formed two lower highs, indicating weaknesses in the price rally. Eventually, the 50-day moving average (MA) climbed, extending support to the volatile price movement. These converging moving averages initiated a fresh bullish breakout for PFE in December 2010. The average directional index (ADX) (14) in Figure 1, which was unable to surge above 30 levels could rocket comfortably in a developed uptrend region. We can see the huge rise in buying after the 200-day MA breakout. |
| The moving average convergence/divergence (MACD) (12,26,9) and relative strength index (RSI) (14) also moved upward to indicate the developing bullish strength in the breakout journey. The MACD (12,26,9) turned positive by undergoing a bullish crossover in negative territory. The RSI (14) had a stable ride from the center line support (50 levels). Therefore, the scenario produced strong bullish sentiments, which was enough to pull PFE from the thick bearish clouds. |

|
| FIGURE 1: PFE, WEEKLY |
| Graphic provided by: StockCharts.com. |
| |
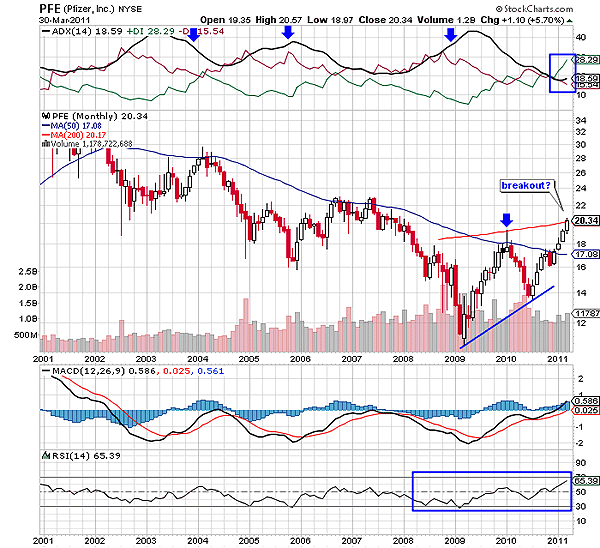
| PFE moved from $17 to $20; although the rally was pretty slow, the uptrend turned overheated. The MACD (12,26,9) continued to be positive, but the overbought RSI (14) seemed reluctant to cross the 70 levels. This signifies that PFE could enter a sideways consolidation to maintain its bullish force. Though the uptrend is overheated, the ADX (14) is currently not suggesting a reversal move. Therefore, a consolidation is a likely possibility. |

|
| FIGURE 2: PFE, MONTHLY |
| Graphic provided by: StockCharts.com. |
| |
| The bullish 200-day MA breakout started awakening long-term buyers. The monthly chart in Figure 2 shows that buying pressure indicated by the positive directional index (+DI) of the ADX (14) has surged above 20 levels for the first time in the past 10 years. The price has established support at the 50-day MA and is ready to breach the strongest 200-day MA resistance. The MACD (12,26,9) has hit the zero line, the RSI (14) is marginally overbought at 65 levels, but the ADX (14) is below 20 levels. The breakout would definitely occur once the uptrend develops. Otherwise, the technical chart looks perfect to undergo a long-awaited makeover. |
| A bullish breakout would be a major event for PFE as the stock has been underperforming for the past 10 years. The declining 50-day MA in Figure 2 has always discouraged the upward price movement, forcing the stock to follow its (50-day MA) direction. Therefore, PFE should be added to your watchlist. |
Active trader in the Indian stock markets since 2003 and a full-time writer. Trading is largely based upon technical analysis.
| Company: | Independent |
| Address: | C1/3 Parth Indraprasth Towers. Vastrapur |
| Ahmedabad, Guj 380015 | |
| E-mail address: | chaitalimohile@yahoo.co.in |
Traders' Resource Links | |
| Independent has not added any product or service information to TRADERS' RESOURCE. | |
Click here for more information about our publications!
PRINT THIS ARTICLE

Request Information From Our Sponsors
- VectorVest, Inc.
- Executive Premier Workshop
- One-Day Options Course
- OptionsPro
- Retirement Income Workshop
- Sure-Fire Trading Systems (VectorVest, Inc.)
- Trading as a Business Workshop
- VectorVest 7 EOD
- VectorVest 7 RealTime/IntraDay
- VectorVest AutoTester
- VectorVest Educational Services
- VectorVest OnLine
- VectorVest Options Analyzer
- VectorVest ProGraphics v6.0
- VectorVest ProTrader 7
- VectorVest RealTime Derby Tool
- VectorVest Simulator
- VectorVest Variator
- VectorVest Watchdog
- StockCharts.com, Inc.
- Candle Patterns
- Candlestick Charting Explained
- Intermarket Technical Analysis
- John Murphy on Chart Analysis
- John Murphy's Chart Pattern Recognition
- John Murphy's Market Message
- MurphyExplainsMarketAnalysis-Intermarket Analysis
- MurphyExplainsMarketAnalysis-Visual Analysis
- StockCharts.com
- Technical Analysis of the Financial Markets
- The Visual Investor
