HOT TOPICS LIST
- MACD
- Fibonacci
- RSI
- Gann
- ADXR
- Stochastics
- Volume
- Triangles
- Futures
- Cycles
- Volatility
- ZIGZAG
- MESA
- Retracement
- Aroon
INDICATORS LIST
LIST OF TOPICS
PRINT THIS ARTICLE
by Mike Carr, CMT
Locked in a downtrend since 2005, natural gas has bounced more than 15% higher in recent weeks.
Position: N/A
Mike Carr, CMT
Mike Carr, CMT, is a member of the Market Technicians Association, and editor of the MTA's newsletter, Technically Speaking. He is also the author of "Smarter Investing in Any Economy: The Definitive Guide to Relative Strength Investing," and "Conquering the Divide: How to Use Economic Indicators to Catch Stock Market Trends."
PRINT THIS ARTICLE
RATE OF CHANGE
Natural Gas Finally Moving Higher?
03/31/11 12:57:19 PMby Mike Carr, CMT
Locked in a downtrend since 2005, natural gas has bounced more than 15% higher in recent weeks.
Position: N/A
| Bear markets eventually give way to bull markets. The problem many traders facing is trying to identify when those turning points take place. Contrarian investment strategies look for turning points based on the idea that the crowd will always be wrong at significant trend reversals. The problem with these strategies is the crowd will generally be correct during the bulk of the trend because the crowd's investment capital is what drives the price trend. When there are more buyers than sellers, prices rise, no matter what the sentiment numbers say. |
| With natural gas and other futures contracts, the Commitment of Traders Report published by the Commodity Futures Trading Commission is often used to gauge sentiment. This report shows the number of contracts in a particular commodity that are held by commercials (those that actually use the commodity), large speculators (generally assumed to be hedge funds), and small speculators (who are individual traders). Commercials have been long natural gas since 2008, and large speculators have been short that whole time. It appears that little can be gained from this data. |
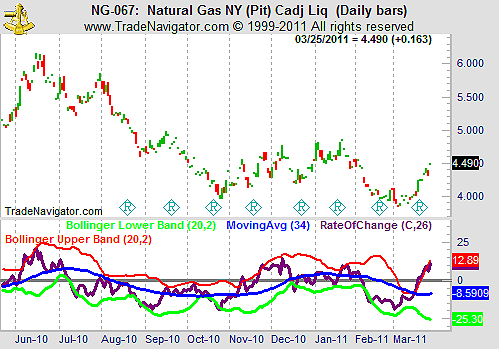
| Rather than watching what traders are reporting, we can use price to watch what the buying and selling is doing in reaction to the changing positions. Figure 1 shows the recent rise in price the contract has seen. The rate of change (ROC) indicator is also shown, along with Bollinger bands on that indicator. The recent price surge has pushed the indicator above the upper band. |

|
| FIGURE 1. Natural gas is more than 16% above its recent bottom. |
| Graphic provided by: Trade Navigator. |
| |
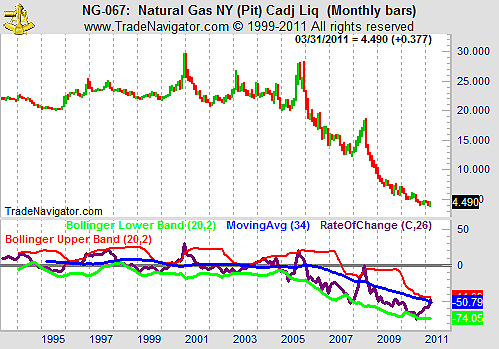
| For a longer-term perspective, the monthly chart is shown in Figure 2. ROC has bounced between the Bollinger bands, and this represents the fourth time it has approached the upper band in this time frame since the bear market began. |

|
| FIGURE 2. Prices have been moving lower for years, as seen in the monthly chart. |
| Graphic provided by: Trade Navigator. |
| |
| In time we will know whether the recent move higher is the beginning of a new bull market or simply another overbought bounce in an ongoing bear market. Traders should be watching for a possible breakout. |
Mike Carr, CMT, is a member of the Market Technicians Association, and editor of the MTA's newsletter, Technically Speaking. He is also the author of "Smarter Investing in Any Economy: The Definitive Guide to Relative Strength Investing," and "Conquering the Divide: How to Use Economic Indicators to Catch Stock Market Trends."
| Website: | www.moneynews.com/blogs/MichaelCarr/id-73 |
| E-mail address: | marketstrategist@gmail.com |
Click here for more information about our publications!
PRINT THIS ARTICLE

Request Information From Our Sponsors
- StockCharts.com, Inc.
- Candle Patterns
- Candlestick Charting Explained
- Intermarket Technical Analysis
- John Murphy on Chart Analysis
- John Murphy's Chart Pattern Recognition
- John Murphy's Market Message
- MurphyExplainsMarketAnalysis-Intermarket Analysis
- MurphyExplainsMarketAnalysis-Visual Analysis
- StockCharts.com
- Technical Analysis of the Financial Markets
- The Visual Investor
- VectorVest, Inc.
- Executive Premier Workshop
- One-Day Options Course
- OptionsPro
- Retirement Income Workshop
- Sure-Fire Trading Systems (VectorVest, Inc.)
- Trading as a Business Workshop
- VectorVest 7 EOD
- VectorVest 7 RealTime/IntraDay
- VectorVest AutoTester
- VectorVest Educational Services
- VectorVest OnLine
- VectorVest Options Analyzer
- VectorVest ProGraphics v6.0
- VectorVest ProTrader 7
- VectorVest RealTime Derby Tool
- VectorVest Simulator
- VectorVest Variator
- VectorVest Watchdog
