HOT TOPICS LIST
- MACD
- Fibonacci
- RSI
- Gann
- ADXR
- Stochastics
- Volume
- Triangles
- Futures
- Cycles
- Volatility
- ZIGZAG
- MESA
- Retracement
- Aroon
INDICATORS LIST
LIST OF TOPICS
PRINT THIS ARTICLE
by Austin Passamonte
Here's the midterm price outlook for electronic grain futures.
Position: N/A
Austin Passamonte
Austin is a private trader who trades emini stock index futures intraday. He currently trades various futures markets from home in addition to managing a trader's educational forum
PRINT THIS ARTICLE
TECHNICAL ANALYSIS
Whole Grain Season
03/31/11 11:51:17 AMby Austin Passamonte
Here's the midterm price outlook for electronic grain futures.
Position: N/A
| Inflation is real, it is entrenched, and it is clearly visible in commodity markets across the spectrum. Grain futures have enjoyed a significant rise in value these past couple of years, with no real end in sight. But grain traders do need to monitor the charts for potential dips and deep pullbacks against the prevailing uptrend, at the very least. |

|
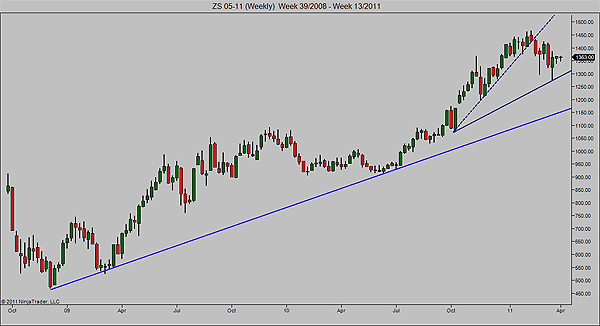
| FIGURE 1: SOYBEAN FUTURES, WEEKLY |
| Graphic provided by: NinjaTrader. |
| |
| Figure 1, a weekly chart of soybeans (ZS), shows the (contract-adjusted) ascent from 500 zone back in late 2008 to early 2009 all the way up to 14+ at peak highs in early 2011. Along the way, it formed an ascending trendline (blue) that projects lower levels of support at the 1175 area currently. That is the well-watched level for trend-followers as the next place to add long positions, should price pull back that far. |

|
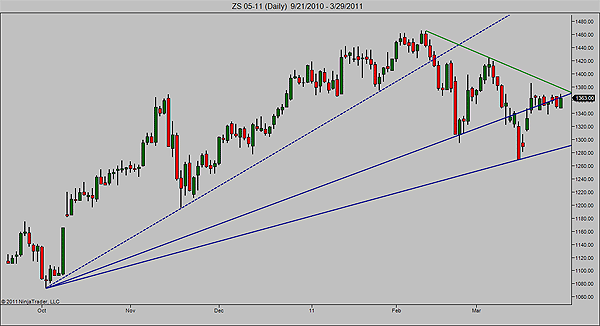
| FIGURE 2: SOYBEAN FUTURES, DAILY |
| Graphic provided by: NinjaTrader. |
| |
| Dialed down to a daily-chart view (Figure 2), we can see where trendlines from Oct 2010 through present have formed, failed, and tested, respectively. The dashed line was the first to break in early February 2011. The next line lower is currently magnetized near the 1360 general zone. The last line below on the daily-chart spectrum suggests a dip to the 1300 area, finding near-term support there. If tested and broken, the long-term line on the weekly chart is next (Figure 3). On the other hand, if the descending trendline (green) is broken upside, that should be good to go toward further highs. |

|
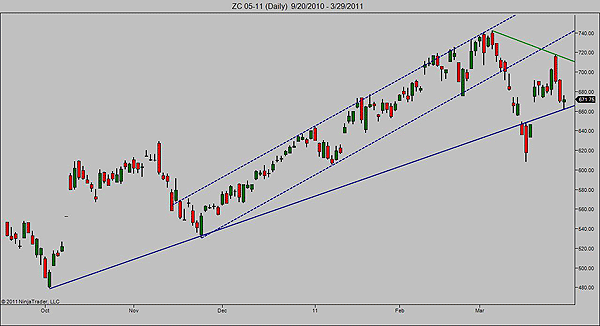
| FIGURE 3: CORN FUTURES, DAILY |
| Graphic provided by: NinjaTrader. |
| |
| Switching to the daily chart of pit-session corn, similar patterns exist. Corn rode an ascending channel since last autumn, recently broke downside, and it tests the lower trendline in this time frame now. Another closing sequence below 660 brings 620 into play, if not considerably lower. Likewise, a break above the descending trendline (green) near 710 and return inside channel resumes the uptrend. |
| Planting season for small grains is nearly upon us. We can expect weather-related news to affect short-term price with increased volatility around production reports. Keeping our eyes on the longer-term chart structure will keep clarity in view amid any short-term turbulence ahead. |
Austin is a private trader who trades emini stock index futures intraday. He currently trades various futures markets from home in addition to managing a trader's educational forum
| Title: | Individual Trader |
| Company: | CoiledMarkets.com |
| Address: | PO Box 633 |
| Naples, NY 14512 | |
| Website: | coiledmarkets.com/blog |
| E-mail address: | austinp44@yahoo.com |
Traders' Resource Links | |
| CoiledMarkets.com has not added any product or service information to TRADERS' RESOURCE. | |
Click here for more information about our publications!
PRINT THIS ARTICLE

Request Information From Our Sponsors
- StockCharts.com, Inc.
- Candle Patterns
- Candlestick Charting Explained
- Intermarket Technical Analysis
- John Murphy on Chart Analysis
- John Murphy's Chart Pattern Recognition
- John Murphy's Market Message
- MurphyExplainsMarketAnalysis-Intermarket Analysis
- MurphyExplainsMarketAnalysis-Visual Analysis
- StockCharts.com
- Technical Analysis of the Financial Markets
- The Visual Investor
- VectorVest, Inc.
- Executive Premier Workshop
- One-Day Options Course
- OptionsPro
- Retirement Income Workshop
- Sure-Fire Trading Systems (VectorVest, Inc.)
- Trading as a Business Workshop
- VectorVest 7 EOD
- VectorVest 7 RealTime/IntraDay
- VectorVest AutoTester
- VectorVest Educational Services
- VectorVest OnLine
- VectorVest Options Analyzer
- VectorVest ProGraphics v6.0
- VectorVest ProTrader 7
- VectorVest RealTime Derby Tool
- VectorVest Simulator
- VectorVest Variator
- VectorVest Watchdog
