HOT TOPICS LIST
- MACD
- Fibonacci
- RSI
- Gann
- ADXR
- Stochastics
- Volume
- Triangles
- Futures
- Cycles
- Volatility
- ZIGZAG
- MESA
- Retracement
- Aroon
INDICATORS LIST
LIST OF TOPICS
PRINT THIS ARTICLE
by Chaitali Mohile
After the breakout, Buckle is likely to be the best stock to buy.
Position: Buy
Chaitali Mohile
Active trader in the Indian stock markets since 2003 and a full-time writer. Trading is largely based upon technical analysis.
PRINT THIS ARTICLE
FLAGS AND PENNANTS
Buckle Consolidation
03/30/11 01:06:07 PMby Chaitali Mohile
After the breakout, Buckle is likely to be the best stock to buy.
Position: Buy
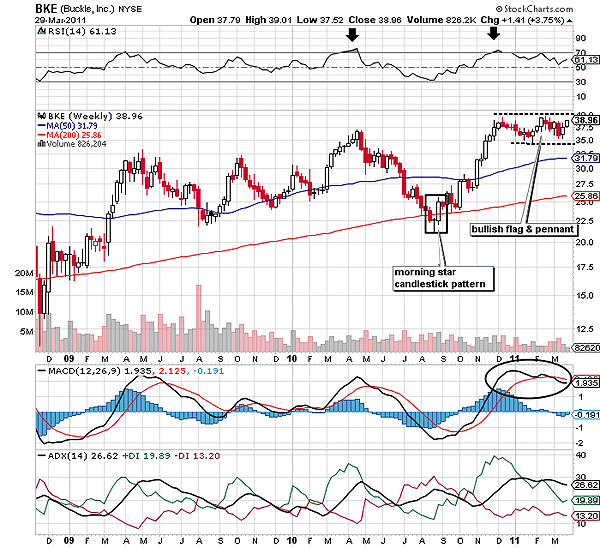
| Buckle, Inc. (BKE), has been undergoing a bullish consolidation for about two months. The stock began its bullish journey with a morning star candlestick pattern (Figure 1). The morning star is one of the most reliable bullish trend reversal candlestick patterns. It is a cluster of the three candles; the first bearish candle reflects the existing downtrend and the middle candle is the doji, followed by the white bullish candle resembling the new uptrend. We can see in the box in Figure 1 that the candlestick pattern has the support of the 200-day moving average (MA). The support established enhanced the possibility of a fresh upward rally. |
| An oversold relative strength index (RSI) (14) moved in the north direction, a developing downtrend of the average directional index (ADX) (14) reversed. The moving average convergence/divergence (MACD) (12,26,9) showed a bullish crossover in negative territory and surged toward the zero line. Therefore, the new rally has the robust bullish strength to travel higher. BKE gained 15 points from the rally. Later, the stock entered short-term consolidation in a wide range of 39 and 35. Due to the high volatility, the trading volume was depressed (Figure 1). |

|
| FIGURE 1: BKE, WEEKLY |
| Graphic provided by: StockCharts.com. |
| |
| However, all the three indicators flicker in their bullish zones. The consolidation was followed by the advance rally from 22 to 39, forming a bullish flag & pennant formation in Figure 1. Although the consolidation period was very large (December 2010 to March 2011), the oscillators on the weekly chart are not reflecting any weakness. Therefore, we can consider this pattern to be a bullish continuation pattern. After a breakout, BKE would resume its existing bullish rally. The medium-term potential target would be 39 - 22 = 17 + 39 = 56. This minimum estimated level is good enough to attract new buyers and increases the buying pressure for strengthening the current uptrend. |
| Thus, the bullish breakout of BKE would offer a good buying opportunity for traders and investors. |
Active trader in the Indian stock markets since 2003 and a full-time writer. Trading is largely based upon technical analysis.
| Company: | Independent |
| Address: | C1/3 Parth Indraprasth Towers. Vastrapur |
| Ahmedabad, Guj 380015 | |
| E-mail address: | chaitalimohile@yahoo.co.in |
Traders' Resource Links | |
| Independent has not added any product or service information to TRADERS' RESOURCE. | |
Click here for more information about our publications!
PRINT THIS ARTICLE

Request Information From Our Sponsors
- StockCharts.com, Inc.
- Candle Patterns
- Candlestick Charting Explained
- Intermarket Technical Analysis
- John Murphy on Chart Analysis
- John Murphy's Chart Pattern Recognition
- John Murphy's Market Message
- MurphyExplainsMarketAnalysis-Intermarket Analysis
- MurphyExplainsMarketAnalysis-Visual Analysis
- StockCharts.com
- Technical Analysis of the Financial Markets
- The Visual Investor
- VectorVest, Inc.
- Executive Premier Workshop
- One-Day Options Course
- OptionsPro
- Retirement Income Workshop
- Sure-Fire Trading Systems (VectorVest, Inc.)
- Trading as a Business Workshop
- VectorVest 7 EOD
- VectorVest 7 RealTime/IntraDay
- VectorVest AutoTester
- VectorVest Educational Services
- VectorVest OnLine
- VectorVest Options Analyzer
- VectorVest ProGraphics v6.0
- VectorVest ProTrader 7
- VectorVest RealTime Derby Tool
- VectorVest Simulator
- VectorVest Variator
- VectorVest Watchdog
