HOT TOPICS LIST
- MACD
- Fibonacci
- RSI
- Gann
- ADXR
- Stochastics
- Volume
- Triangles
- Futures
- Cycles
- Volatility
- ZIGZAG
- MESA
- Retracement
- Aroon
INDICATORS LIST
LIST OF TOPICS
PRINT THIS ARTICLE
by David Penn
Since hitting a bottom in November, June crude has gained more than 20%. Does a second failed test of the rally high mean the party's over for the bulls?
Position: N/A
David Penn
Technical Writer for Technical Analysis of STOCKS & COMMODITIES magazine, Working-Money.com, and Traders.com Advantage.
PRINT THIS ARTICLE
TECHNICAL ANALYSIS
Light Crude Tests Rally Top
03/01/02 11:30:49 AMby David Penn
Since hitting a bottom in November, June crude has gained more than 20%. Does a second failed test of the rally high mean the party's over for the bulls?
Position: N/A
| After months of declines, a number of commodities hit bottoms in the fall of 2001. Gold, which tends to lead the price action of commodities, bottomed in April 2001, and most of the other major commodities followed suit. Coffee and cotton both bottomed in September, the CRB index bottomed in October, copper and light crude in November. Not all commodities followed this pattern--especially the agricultural commodities like soybeans and wheat--but the fact that so many commodities did gives hope to those looking to get long in a commodities market that has been relentlessly bearish. |
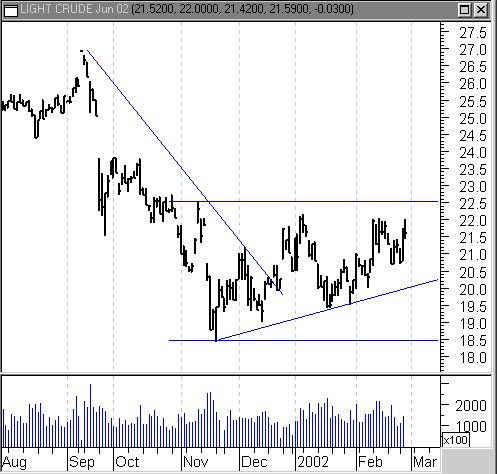
| Crude, per the June contract, has been in an uptrend since mid-November's low at 18.3. The uptrend has not been without its volatility--June crude hit 22 in early January, then dropped to 19.50 by mid-January and back to 22 by mid-February. The 22 level, however, represents significant resistance ever since being established by the December light crude rally. This resistance level has been tested at least five times since, and prices still remain closer to a test of resistance at 22 than they do to a test of support at 20, where the uptrend line provides a possible limit to the downside. |

|
| Although facing stiff resistance, June crude struggles toward a test of rally top. |
| Graphic provided by: MetaStock. |
| |
| However, looking at the current rally in June crude as a part of the larger trend may help shed some light on the current advances' bullish merits. June crude's rally comes after a short, sharp decline from just over 26 to just over 18, a 31% move. The current rally has retraced about three and a half points from that eight-point decline, a retracement of about 43%. This is a significant retracement in Fibonacci terms--more than the 33% threshold (which would have represented a rally to 21), yet less than the 66% mark (which would have represented a rally to about 24). Additionally, each of those two Fibonacci retracement points represents a signficant point in the price action of June crude. More specifically, the 33% retracement level equals the support level from the early December spike (and the lows in the latter half of February). The 66% retracement level matches up with the point at which June crude gapped down in the wake of the September 11th terrorist attacks in the United States. |
| So where does that leave June crude? While the three and a half month trend is up, and the 44% retracement is certainly bullish, resistance to further advances in crude is extensive. Not only do the stall-outs at 22 from the December and February rallies work against a major advance, but also resistance in the form of both the November 2001 high at 22.5 and the September/October 2001 peaks just shy of 24 await any advance in crude. On the downside, although there is a recent correction low at 20.75 that might provide some brake to a slide in crude, the more likely source of support is at the uptrend line--now at 20. |
Technical Writer for Technical Analysis of STOCKS & COMMODITIES magazine, Working-Money.com, and Traders.com Advantage.
| Title: | Technical Writer |
| Company: | Technical Analysis, Inc. |
| Address: | 4757 California Avenue SW |
| Seattle, WA 98116 | |
| Phone # for sales: | 206 938 0570 |
| Fax: | 206 938 1307 |
| Website: | www.Traders.com |
| E-mail address: | DPenn@traders.com |
Traders' Resource Links | |
| Charting the Stock Market: The Wyckoff Method -- Books | |
| Working-Money.com -- Online Trading Services | |
| Traders.com Advantage -- Online Trading Services | |
| Technical Analysis of Stocks & Commodities -- Publications and Newsletters | |
| Working Money, at Working-Money.com -- Publications and Newsletters | |
| Traders.com Advantage -- Publications and Newsletters | |
| Professional Traders Starter Kit -- Software | |
Click here for more information about our publications!
Comments
Date: 03/11/02Rank: 4Comment:

Request Information From Our Sponsors
- StockCharts.com, Inc.
- Candle Patterns
- Candlestick Charting Explained
- Intermarket Technical Analysis
- John Murphy on Chart Analysis
- John Murphy's Chart Pattern Recognition
- John Murphy's Market Message
- MurphyExplainsMarketAnalysis-Intermarket Analysis
- MurphyExplainsMarketAnalysis-Visual Analysis
- StockCharts.com
- Technical Analysis of the Financial Markets
- The Visual Investor
- VectorVest, Inc.
- Executive Premier Workshop
- One-Day Options Course
- OptionsPro
- Retirement Income Workshop
- Sure-Fire Trading Systems (VectorVest, Inc.)
- Trading as a Business Workshop
- VectorVest 7 EOD
- VectorVest 7 RealTime/IntraDay
- VectorVest AutoTester
- VectorVest Educational Services
- VectorVest OnLine
- VectorVest Options Analyzer
- VectorVest ProGraphics v6.0
- VectorVest ProTrader 7
- VectorVest RealTime Derby Tool
- VectorVest Simulator
- VectorVest Variator
- VectorVest Watchdog
