HOT TOPICS LIST
- MACD
- Fibonacci
- RSI
- Gann
- ADXR
- Stochastics
- Volume
- Triangles
- Futures
- Cycles
- Volatility
- ZIGZAG
- MESA
- Retracement
- Aroon
INDICATORS LIST
LIST OF TOPICS
PRINT THIS ARTICLE
by Koos van der Merwe
Looking for a system to use for investment purposes can always be a challenge.
Position: Accumulate
Koos van der Merwe
Has been a technical analyst since 1969, and has worked as a futures and options trader with First Financial Futures in Johannesburg, South Africa.
PRINT THIS ARTICLE
GANN ANGLE
Using Gann Lines
03/30/11 08:05:24 AMby Koos van der Merwe
Looking for a system to use for investment purposes can always be a challenge.
Position: Accumulate
| Gann lines are drawn after a Gann fan has been identified for a particular stock. Once the Gann fan has been identified, we choose the Gann line that is the most obvious to apply to the share you are looking at. Here are two examples: |

|
| FIGURE 1: GANN FAN |
| Graphic provided by: AdvancedGET. |
| |
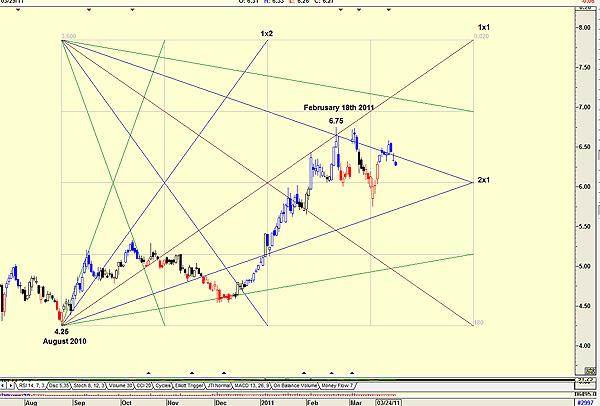
| Figure 1 shows how I chose a Gann fan on Bombardier (BBD-T), a Canadian stock. My chart shows the low of $4.25 on August 2010. From that date I have drawn a Gann fan as close to the high of $6.75 on February 18, 2011, as possible. With today's charting techniques, we can draw a Gann fan that tops out at the high. However, I prefer sticking to the original Gann numbers -- namely, 1, 2, 5 and so on and divisions and multiplications by 10 of those numbers. In this instance, the number I have used for the Gann fan is 0.020. Once I have identified the fan, I look for the 1x1 angle or the 2x1 angle and apply it to the pivot points of the stock, as shown in Figure 2. |

|
| FIGURE 2: GANN LINES ON BOMBARDIER |
| Graphic provided by: AdvancedGET. |
| |
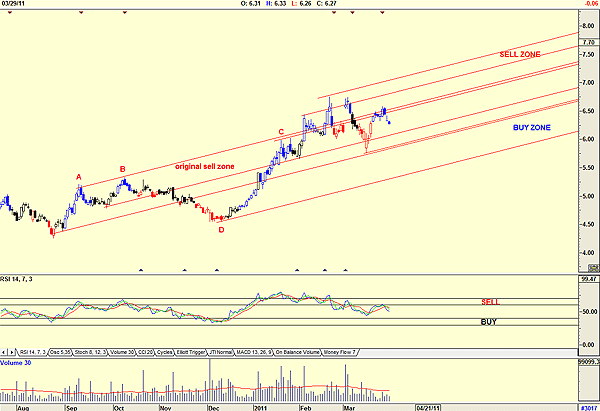
| Figure 2 shows that I chose the 1x2 line as my Gann angle. The reason I did this is because the relative strength index (RSI) is trending down, which means that the price is moving down from the sell zone toward the buy zone. Note how the original sell zone was drawn from the pivot points of A and B. We could have sold at C, and I would have enjoyed a comfortable profit; however, in today's world, you run with the trend, governed by a rising stop-loss order. This would have led me to the new sell zone, which is what I will now use in the future. The buy zone has not changed, however, and has been drawn from the pivot point at D, which was given as a buy by the RSI. The present trend is down, and I shall only buy when the price is in the buy zone and the RSI suggests a buy. |

|
| FIGURE 3: GANN LINE ON CITIGROUP |
| Graphic provided by: AdvancedGET. |
| |
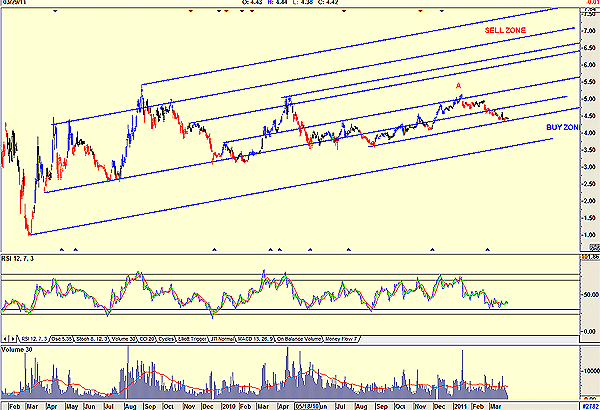
| Figure 3 is a chart of Citigroup (C) and suggests that the share price is close to the buy zone. This is confirmed by the RSI, which is close to giving a buy signal. Do note that the sell at A was not given in the sell zone. I would therefore be very cautious with Citigroup, and look for a share where the Gann lines drawn from pivot points are very obvious. Gann lines drawn from Gann fans can identify a share that we can invest in, identifying buy and sell areas. |
Has been a technical analyst since 1969, and has worked as a futures and options trader with First Financial Futures in Johannesburg, South Africa.
| Address: | 3256 West 24th Ave |
| Vancouver, BC | |
| Phone # for sales: | 6042634214 |
| E-mail address: | petroosp@gmail.com |
Click here for more information about our publications!
Comments

Request Information From Our Sponsors
- StockCharts.com, Inc.
- Candle Patterns
- Candlestick Charting Explained
- Intermarket Technical Analysis
- John Murphy on Chart Analysis
- John Murphy's Chart Pattern Recognition
- John Murphy's Market Message
- MurphyExplainsMarketAnalysis-Intermarket Analysis
- MurphyExplainsMarketAnalysis-Visual Analysis
- StockCharts.com
- Technical Analysis of the Financial Markets
- The Visual Investor
- VectorVest, Inc.
- Executive Premier Workshop
- One-Day Options Course
- OptionsPro
- Retirement Income Workshop
- Sure-Fire Trading Systems (VectorVest, Inc.)
- Trading as a Business Workshop
- VectorVest 7 EOD
- VectorVest 7 RealTime/IntraDay
- VectorVest AutoTester
- VectorVest Educational Services
- VectorVest OnLine
- VectorVest Options Analyzer
- VectorVest ProGraphics v6.0
- VectorVest ProTrader 7
- VectorVest RealTime Derby Tool
- VectorVest Simulator
- VectorVest Variator
- VectorVest Watchdog
