HOT TOPICS LIST
- MACD
- Fibonacci
- RSI
- Gann
- ADXR
- Stochastics
- Volume
- Triangles
- Futures
- Cycles
- Volatility
- ZIGZAG
- MESA
- Retracement
- Aroon
INDICATORS LIST
LIST OF TOPICS
PRINT THIS ARTICLE
by Billy Williams
At first glance, it seems like the market is gathering support and trying to mount another bull run, but a closer look reveals that all is not what it seems.
Position: Hold
Billy Williams
Billy Williams has been trading the markets for 27 years, specializing in momentum trading with stocks and options.
PRINT THIS ARTICLE
Hunting Down Stocks On The Move
03/30/11 07:56:34 AMby Billy Williams
At first glance, it seems like the market is gathering support and trying to mount another bull run, but a closer look reveals that all is not what it seems.
Position: Hold
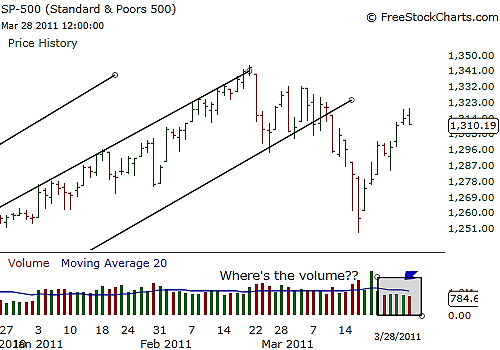
| Looking at a daily price chart, you can see the technical damage that was incurred by mounting distribution days where the bullish price channel and long-term trendline was broken, but you can also see that volume has not confirmed any kind of support by the buyers yet. On March 16, 2011, a significant low in the Standard & Poor's 500 was established since the decline occurred and the bullish trend began to falter, but on March 18, 2011, a rally day seemed to have appeared. To mark a turn in the market's downward move using the O'Neil follow-through day, you would have to wait for a strong rally day where the day gained at least 1% on a higher than the previous day's volume. While the volume was there in full force, the day's gains were less than the required 1%. |

|
| FIGURE 1: S&P 500. Classic head fake by the big traders that plays to the hopes of a bull run by smaller investors but not confirmed by daily gains or higher volume. Large traders use these days to make their selling. |
| Graphic provided by: www.freestockcharts.com. |
| |
| In fact, due to the open and close of that day occurring near the same price level coupled with tremendous volume, this day can be interpreted as a "head fake" by the big players in the market, where the appearance of a strong rally is given, but in actuality they are selling off their positions. This is a classic feint by professional speculators on an unsuspecting investment class that plays to their hopes of a new rally while offering big institutions and hedge funds a distribution day to liquidate their holdings. Since the market's hope of a new bullish trend is still in doubt, this is a good time to begin fielding new stock-buy candidates to create a hit list of potential longs for when the market does turn. The universe of stocks tend to move in tandem with the stock market, particularly the S&P 500, but in a weak market, stocks that move away from the downtrend show the potential to be new leaders in the next rally. This stock leadership means that they will be the stocks that go on to newer successive price highs and, as a result, take the market higher as well. |

|
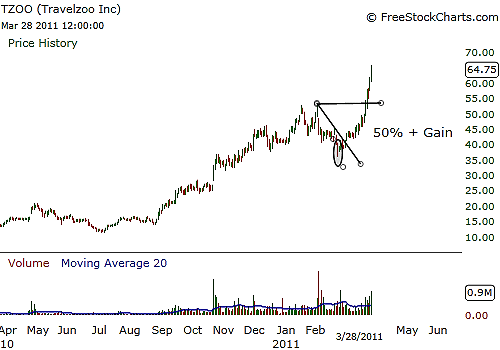
| FIGURE 2: TZOO. TZOO is performing well in a weak market even while putting in a 50% + gain from its low to a new high, showing incredible momentum that could take it even higher and the market along with it. |
| Graphic provided by: www.freestockcharts.com. |
| |
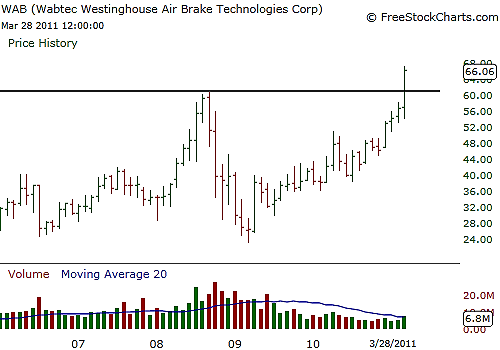
| In order to select the best stocks, you should begin by looking for stocks that are holding up well in the current downturn. Stocks that are holding their price bases near their all-time price highs and are spotted with increasing trade volume indicate strength in an overall weak market. At a fundamental level, you want to look for stocks that have higher earnings currently but also year-over-year and quarter-over-quarter on comparative basis and as high as possible, but at least 25% or greater. Return-on-equity should be at least 17%, but as high as possible; ROE shows that a company has capable management that knows how to get a good return on their shareholders' capital investments. |

|
| FIGURE 3: WAB. WAB has just traded past its old price high established years ago and clearly shows strength in a declining market, making this a potential stock market leader once the market turns upward again. |
| Graphic provided by: www.freestockcharts.com. |
| |
| In addition, companies that have as low a debt as possible are also strong candidates; debt is an albatross hanging around the neck of a good company. Bad debt can be a leech sucking away at the marrow of a company's earnings and a drag on its future prospects. Pick companies that have at least a 20-day average of 300,000 shares trading daily at the moment you take a position. Some stocks will be trading less than that at the moment you first notice them, but after a while, they will begin to increase, and by the time a buy entry appears, their volume will be appropriate. If not, use caution because it makes it more difficult to get in and out of a stock if the volume is not there to offer the liquidity you need. |
Billy Williams has been trading the markets for 27 years, specializing in momentum trading with stocks and options.
| Company: | StockOptionSystem.com |
| E-mail address: | stockoptionsystem.com@gmail.com |
Traders' Resource Links | |
| StockOptionSystem.com has not added any product or service information to TRADERS' RESOURCE. | |
Click here for more information about our publications!
Comments

|

Request Information From Our Sponsors
- StockCharts.com, Inc.
- Candle Patterns
- Candlestick Charting Explained
- Intermarket Technical Analysis
- John Murphy on Chart Analysis
- John Murphy's Chart Pattern Recognition
- John Murphy's Market Message
- MurphyExplainsMarketAnalysis-Intermarket Analysis
- MurphyExplainsMarketAnalysis-Visual Analysis
- StockCharts.com
- Technical Analysis of the Financial Markets
- The Visual Investor
- VectorVest, Inc.
- Executive Premier Workshop
- One-Day Options Course
- OptionsPro
- Retirement Income Workshop
- Sure-Fire Trading Systems (VectorVest, Inc.)
- Trading as a Business Workshop
- VectorVest 7 EOD
- VectorVest 7 RealTime/IntraDay
- VectorVest AutoTester
- VectorVest Educational Services
- VectorVest OnLine
- VectorVest Options Analyzer
- VectorVest ProGraphics v6.0
- VectorVest ProTrader 7
- VectorVest RealTime Derby Tool
- VectorVest Simulator
- VectorVest Variator
- VectorVest Watchdog
