HOT TOPICS LIST
- MACD
- Fibonacci
- RSI
- Gann
- ADXR
- Stochastics
- Volume
- Triangles
- Futures
- Cycles
- Volatility
- ZIGZAG
- MESA
- Retracement
- Aroon
INDICATORS LIST
LIST OF TOPICS
PRINT THIS ARTICLE
by Austin Passamonte
Here's a midterm price direction for the Standard & Poor's 500 index futures.
Position: N/A
Austin Passamonte
Austin is a private trader who trades emini stock index futures intraday. He currently trades various futures markets from home in addition to managing a trader's educational forum
PRINT THIS ARTICLE
TECHNICAL ANALYSIS
Kiss Goodbye?
03/28/11 08:56:24 AMby Austin Passamonte
Here's a midterm price direction for the Standard & Poor's 500 index futures.
Position: N/A
| "Prior support now resistance" is an old cliche and a fundamental fact. Levels and measures of price support and resistance revert to opposite forces once broken. Markets have memory, and that memory comes in the form of prior trades stopped long or short. |

|
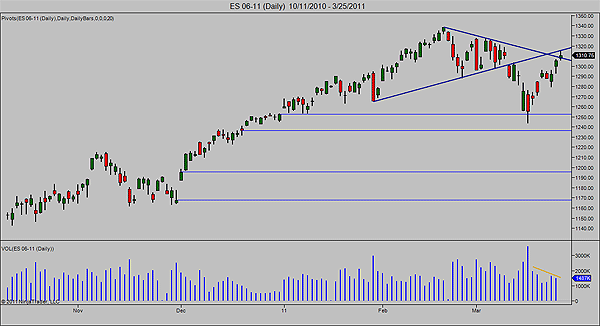
| FIGURE 1: S&P 500 FUTURES (ES) |
| Graphic provided by: NinjaTrader Charts. |
| |
| S&P 500 futures (ES) bottomed on late December gap fills before riding the same upward launch all other stock indexes ride. Once again, lower daily volume on higher daily price levels is the mode of market operation right now. See Figure 1. |
| That ascending trendline from late January lows to late February and early March higher lows formed the bottom of a crisp wedge pattern formation. Textbook technical analysis is at work, price bouncing from one measured magnet to another in search of lasting direction. |
| Friday's price stalled at resistance into the apex of that trendline's wedge. Daily volume held below two million contracts since the recent swing low. Three consecutive open gaps were left behind on that levitation where overnight pushes upward overcame intraday selloffs downward. |
| Financial markets do move in mysterious ways, except for times when it's clear they are being moved during low-volume periods when price is easiest to influence. That can work on a short-term basis, and it can persist for a while. But not forever. If price rejects near current resistance zones and turns lower into increasing volume, it's time to set our sights on 1200s gap fills and below. |
Austin is a private trader who trades emini stock index futures intraday. He currently trades various futures markets from home in addition to managing a trader's educational forum
| Title: | Individual Trader |
| Company: | CoiledMarkets.com |
| Address: | PO Box 633 |
| Naples, NY 14512 | |
| Website: | coiledmarkets.com/blog |
| E-mail address: | austinp44@yahoo.com |
Traders' Resource Links | |
| CoiledMarkets.com has not added any product or service information to TRADERS' RESOURCE. | |
Click here for more information about our publications!
Comments

|

Request Information From Our Sponsors
- StockCharts.com, Inc.
- Candle Patterns
- Candlestick Charting Explained
- Intermarket Technical Analysis
- John Murphy on Chart Analysis
- John Murphy's Chart Pattern Recognition
- John Murphy's Market Message
- MurphyExplainsMarketAnalysis-Intermarket Analysis
- MurphyExplainsMarketAnalysis-Visual Analysis
- StockCharts.com
- Technical Analysis of the Financial Markets
- The Visual Investor
- VectorVest, Inc.
- Executive Premier Workshop
- One-Day Options Course
- OptionsPro
- Retirement Income Workshop
- Sure-Fire Trading Systems (VectorVest, Inc.)
- Trading as a Business Workshop
- VectorVest 7 EOD
- VectorVest 7 RealTime/IntraDay
- VectorVest AutoTester
- VectorVest Educational Services
- VectorVest OnLine
- VectorVest Options Analyzer
- VectorVest ProGraphics v6.0
- VectorVest ProTrader 7
- VectorVest RealTime Derby Tool
- VectorVest Simulator
- VectorVest Variator
- VectorVest Watchdog
