HOT TOPICS LIST
- MACD
- Fibonacci
- RSI
- Gann
- ADXR
- Stochastics
- Volume
- Triangles
- Futures
- Cycles
- Volatility
- ZIGZAG
- MESA
- Retracement
- Aroon
INDICATORS LIST
LIST OF TOPICS
PRINT THIS ARTICLE
by Austin Passamonte
Here's a midterm view of price direction for the Russell 2000 index futures.
Position: N/A
Austin Passamonte
Austin is a private trader who trades emini stock index futures intraday. He currently trades various futures markets from home in addition to managing a trader's educational forum
PRINT THIS ARTICLE
TECHNICAL ANALYSIS
Into Thin Air
03/28/11 08:47:43 AMby Austin Passamonte
Here's a midterm view of price direction for the Russell 2000 index futures.
Position: N/A
| There's an old saying about markets going up like feathers and down like lead balloons. Short-term action can go anywhere at any time on any volume. But over the long term, low-volume ascents are tilted stilts ready to topple at a moment's whim. |

|
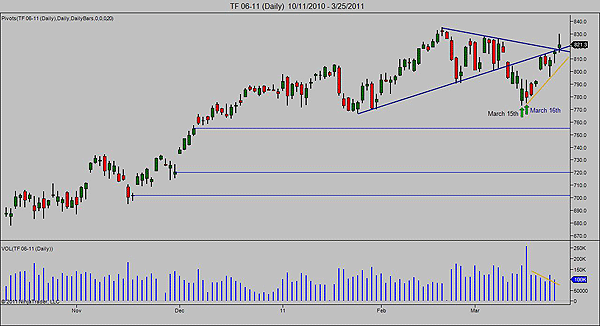
| FIGURE 1: RUSSELL 2000 INDEX FUTURES (TF), DAILY |
| Graphic provided by: NinjaTrader Charts. |
| |
| Russell 2000 index futures (TF) hit a near-term bottom on March 15 before closing positive for that session. March 16 was an inside day with a bearish close on higher volume than the prior session (258,000 contracts) in what appeared to be a pause before continuing lower. See Figure 1. |
| Instead, the small-cap index futures turned and burned upward on yet another gap left open. Daily volume tapered back off to the 100k zone, and the price closed the most recent session charted (Friday, March 25) right on top of the recent apex wedge formation. |
| The fact that price went up while volume went down leaves the week's ascent suspect. Trading long above the wedge support and short on a break back below is one clear demarcation on this chart. In addition, a break back through on the downside would trigger sell-stop orders clustered in the 815 to 810 zone. Accelerated volume and a wave to lower lows where historical gaps still hold open is probable below that 810 zone. |
| Recent multiyear highs are a session or two away from being breached. With a breakout to new highs, it is business as usual for the bulls, while a breakdown below trendline and continued upside is improbable. A return to 790 and a failure to hold equals an acceleration lower to the awaiting gaps below. |
Austin is a private trader who trades emini stock index futures intraday. He currently trades various futures markets from home in addition to managing a trader's educational forum
| Title: | Individual Trader |
| Company: | CoiledMarkets.com |
| Address: | PO Box 633 |
| Naples, NY 14512 | |
| Website: | coiledmarkets.com/blog |
| E-mail address: | austinp44@yahoo.com |
Traders' Resource Links | |
| CoiledMarkets.com has not added any product or service information to TRADERS' RESOURCE. | |
Click here for more information about our publications!
PRINT THIS ARTICLE

Request Information From Our Sponsors
- VectorVest, Inc.
- Executive Premier Workshop
- One-Day Options Course
- OptionsPro
- Retirement Income Workshop
- Sure-Fire Trading Systems (VectorVest, Inc.)
- Trading as a Business Workshop
- VectorVest 7 EOD
- VectorVest 7 RealTime/IntraDay
- VectorVest AutoTester
- VectorVest Educational Services
- VectorVest OnLine
- VectorVest Options Analyzer
- VectorVest ProGraphics v6.0
- VectorVest ProTrader 7
- VectorVest RealTime Derby Tool
- VectorVest Simulator
- VectorVest Variator
- VectorVest Watchdog
- StockCharts.com, Inc.
- Candle Patterns
- Candlestick Charting Explained
- Intermarket Technical Analysis
- John Murphy on Chart Analysis
- John Murphy's Chart Pattern Recognition
- John Murphy's Market Message
- MurphyExplainsMarketAnalysis-Intermarket Analysis
- MurphyExplainsMarketAnalysis-Visual Analysis
- StockCharts.com
- Technical Analysis of the Financial Markets
- The Visual Investor
