HOT TOPICS LIST
- MACD
- Fibonacci
- RSI
- Gann
- ADXR
- Stochastics
- Volume
- Triangles
- Futures
- Cycles
- Volatility
- ZIGZAG
- MESA
- Retracement
- Aroon
INDICATORS LIST
LIST OF TOPICS
PRINT THIS ARTICLE
by Andrew Hetherington
The resilience of eBAY (EBAY) is evident in the chart over the past year. Even in the bad times it flourished. . . somewhat. Now it's time for EBAY to correct.
Position: N/A
Andrew Hetherington
Classic Dow Theorist who trades as a pure technician, using pattern recognition.
PRINT THIS ARTICLE
FAN LINES
Are you bidding on EBAY?
02/28/02 01:28:12 PMby Andrew Hetherington
The resilience of eBAY (EBAY) is evident in the chart over the past year. Even in the bad times it flourished. . . somewhat. Now it's time for EBAY to correct.
Position: N/A
| I had been watching this equity when it broke my third fan line and unfortunately I missed shorting it yesterday (February 26, 2002). I chose to short NTAP instead. Although they are both excellent shorts, I prefer to short within the pattern near the top end. Many have lost money while shorting EBAY over the past year or so. The key is in knowing just when to short it. Timing is critical in shorting, so is concentration. My preference is to limit my shorts to one at a time so I'm not distracted. |
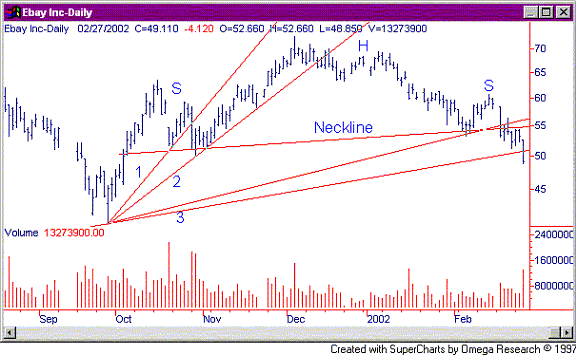
| On the EBAY chart in Figure 1 we have a 5-month head and shoulders pattern. The volume diminishes nicely from the left shoulder towards the right shoulder. It has broken the third fan line 7 days ago at the $55.00 area as well as the neckline. In this example the neckline and the third fan line are in a similar location. Normally, the third fan line will give you an early warning of the ID (impending doom) to come. Trading off of the third fan line can be very profitable, particularly when shorting. After breaking down, there was the typical pullback to the neckline in the $54.00 area on February 26, 2002. This would have been the correct time to short this equity if you hadn't already played it on the break. My expectations are for this to drop to the $43.00 area eventually. If the market conditions improve then this would be a good accumulation place. If conditions remain unclear as they are currently then it will likely drift slightly lower. |

|
| Figure 1: Daily chart for EBAY. |
| Graphic provided by: SuperCharts. |
| |
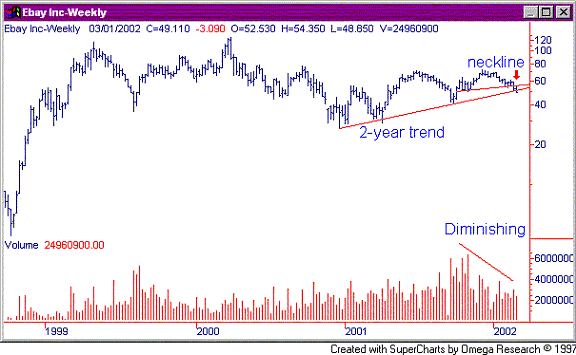
| In Figure 2 we see how well it has performed over the past four years, maintaining most of its growth in the stock price. However, it has just broken its medium term trend by breaking the 2-year trendline. The weakness will continue. If you plan on bidding for EBAY then watch your support lines and pick a place on the way down, and remain aware of the overall market direction. |
 Figure 2: Weekly chart for EBAY. |
Classic Dow Theorist who trades as a pure technician, using pattern recognition.
| Toronto, Canada |
Click here for more information about our publications!
Comments
Date: 03/02/02Rank: 5Comment:
Date: 03/06/02Rank: 1Comment: worthless
Date: 03/09/02Rank: 4Comment:

Request Information From Our Sponsors
- VectorVest, Inc.
- Executive Premier Workshop
- One-Day Options Course
- OptionsPro
- Retirement Income Workshop
- Sure-Fire Trading Systems (VectorVest, Inc.)
- Trading as a Business Workshop
- VectorVest 7 EOD
- VectorVest 7 RealTime/IntraDay
- VectorVest AutoTester
- VectorVest Educational Services
- VectorVest OnLine
- VectorVest Options Analyzer
- VectorVest ProGraphics v6.0
- VectorVest ProTrader 7
- VectorVest RealTime Derby Tool
- VectorVest Simulator
- VectorVest Variator
- VectorVest Watchdog
- StockCharts.com, Inc.
- Candle Patterns
- Candlestick Charting Explained
- Intermarket Technical Analysis
- John Murphy on Chart Analysis
- John Murphy's Chart Pattern Recognition
- John Murphy's Market Message
- MurphyExplainsMarketAnalysis-Intermarket Analysis
- MurphyExplainsMarketAnalysis-Visual Analysis
- StockCharts.com
- Technical Analysis of the Financial Markets
- The Visual Investor
