HOT TOPICS LIST
- MACD
- Fibonacci
- RSI
- Gann
- ADXR
- Stochastics
- Volume
- Triangles
- Futures
- Cycles
- Volatility
- ZIGZAG
- MESA
- Retracement
- Aroon
INDICATORS LIST
LIST OF TOPICS
PRINT THIS ARTICLE
by Koos van der Merwe
Rare earth minerals are an anomaly because they make an individual category in the periodic table of elements.
Position: Buy
Koos van der Merwe
Has been a technical analyst since 1969, and has worked as a futures and options trader with First Financial Futures in Johannesburg, South Africa.
PRINT THIS ARTICLE
TRIANGLES
Molycorp And Rare Earth Minerals
03/25/11 01:47:07 PMby Koos van der Merwe
Rare earth minerals are an anomaly because they make an individual category in the periodic table of elements.
Position: Buy
| Rare earth minerals are found in the periodic table between the elements barium and hafnium. There are 15 rare earth minerals that have been identified. Seven that make up the green element are most sought after. The theory is that rare earth minerals are the result of meteors containing them striking the Earth, which is why they are so rarely found, concentrated only in specific areas on the planet. This means that there is a limited supply available. |
| Colorado-based Molycorp is the only rare earth oxide producer in the Western hemisphere and the company owns the world's largest, most fully developed rare earth project outside of China. The green elements have an ever-growing variety of applications in modern technology. The physical and chemical properties of the rare earth elements contribute essential functions to a range of uses that affect our daily lives; for example, they improve the performance of cell phones, personal digital assistants (PDAs), "ear bud" miniature speakers, media storage systems such as iPods, computers, and vehicles, and they will slowly in the years to come be incorporated in other electronic devices, improving efficiency. |

|
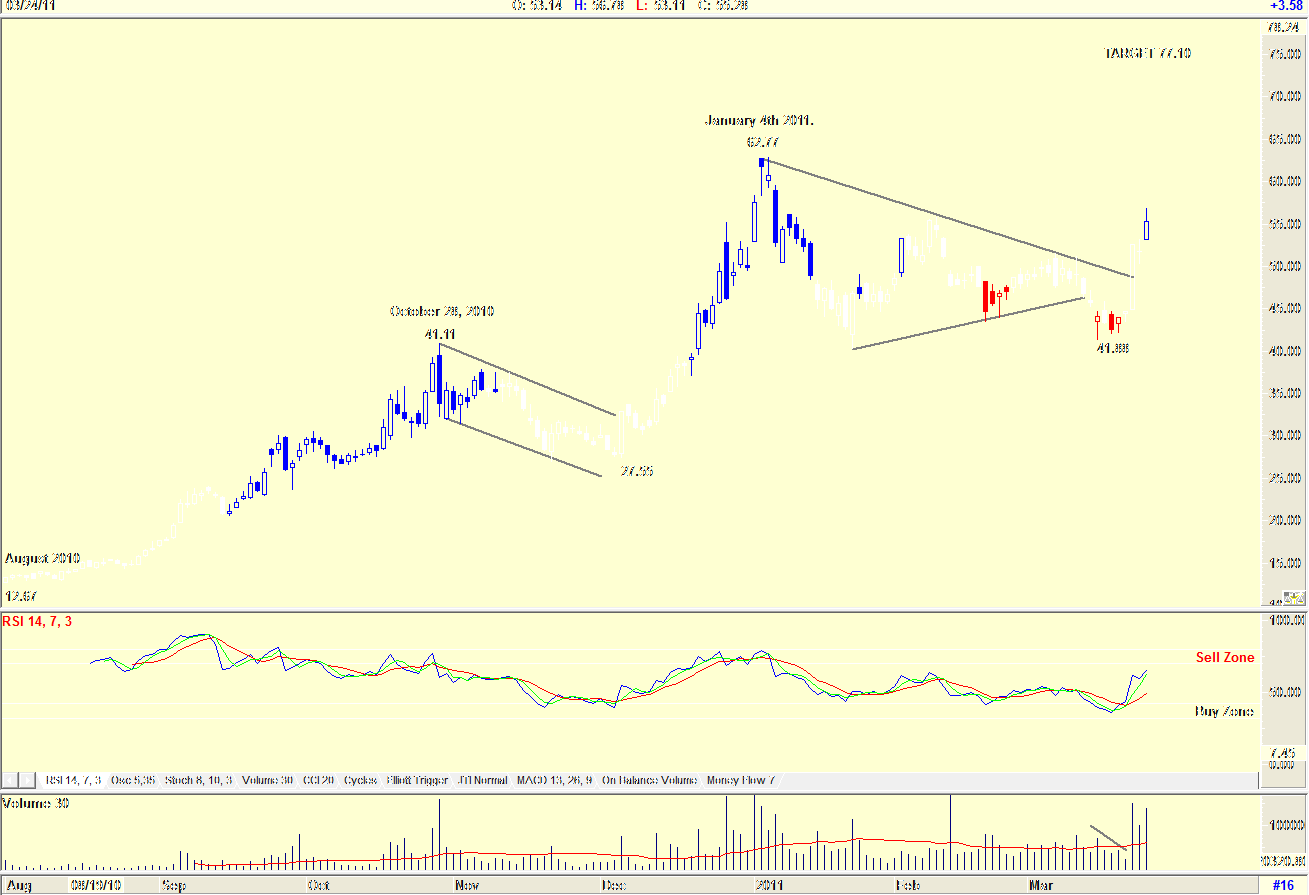
| FIGURE 1: MOLYCORP, DAILY |
| Graphic provided by: AdvancedGET. |
| |
| Figure 1 is a daily chart and shows the following: 1. In August 2010, the price was $12.67 and moved up rapidly to a high of $41.11 by October 2010. 2. The share price then formed a flag pattern with a target of $69.55 (41.11 - 12.67 = 28.44 + 41.11 = 69.55). 3. After reaching the high of $62.77 by January 4, 2011, the price has formed a symmetrical triangle. Symmetrical triangles are not as reliable as head & shoulder formations and really only work out about two-thirds of the time because they are subject to false breakouts. One can see this on the chart where the price first broke downward to a low of $41.88 before moving up. This pattern is known as a shakeout. Do note that as the price fell, volume fell, a sign of weakness. The strength that followed was on high volume, a sign of strength. 4. The target for the triangle breakout is now $77.10 (62.17 -27.55 = 35.22 + 41.88 = 77.10). 5. Do note that the relative strength index (RSI) has confirmed a buy signal. I would be a buyer of Molycorp at present levels for a long-term hold. |
Has been a technical analyst since 1969, and has worked as a futures and options trader with First Financial Futures in Johannesburg, South Africa.
| Address: | 3256 West 24th Ave |
| Vancouver, BC | |
| Phone # for sales: | 6042634214 |
| E-mail address: | petroosp@gmail.com |
Click here for more information about our publications!
Comments
Date: 03/29/11Rank: 5Comment: Good call,
Dick

Request Information From Our Sponsors
- StockCharts.com, Inc.
- Candle Patterns
- Candlestick Charting Explained
- Intermarket Technical Analysis
- John Murphy on Chart Analysis
- John Murphy's Chart Pattern Recognition
- John Murphy's Market Message
- MurphyExplainsMarketAnalysis-Intermarket Analysis
- MurphyExplainsMarketAnalysis-Visual Analysis
- StockCharts.com
- Technical Analysis of the Financial Markets
- The Visual Investor
- VectorVest, Inc.
- Executive Premier Workshop
- One-Day Options Course
- OptionsPro
- Retirement Income Workshop
- Sure-Fire Trading Systems (VectorVest, Inc.)
- Trading as a Business Workshop
- VectorVest 7 EOD
- VectorVest 7 RealTime/IntraDay
- VectorVest AutoTester
- VectorVest Educational Services
- VectorVest OnLine
- VectorVest Options Analyzer
- VectorVest ProGraphics v6.0
- VectorVest ProTrader 7
- VectorVest RealTime Derby Tool
- VectorVest Simulator
- VectorVest Variator
- VectorVest Watchdog
