HOT TOPICS LIST
- MACD
- Fibonacci
- RSI
- Gann
- ADXR
- Stochastics
- Volume
- Triangles
- Futures
- Cycles
- Volatility
- ZIGZAG
- MESA
- Retracement
- Aroon
INDICATORS LIST
LIST OF TOPICS
PRINT THIS ARTICLE
by Alan R. Northam
The Dow Jones Industrial Average Diffusion Index indicates difficulty in the Dow pushing to new higher highs.
Position: N/A
Alan R. Northam
Alan Northam lives in the Dallas, Texas area and as an electronic engineer gave him an analytical mind from which he has developed a thorough knowledge of stock market technical analysis. His abilities to analyze the future direction of the stock market has allowed him to successfully trade of his own portfolio over the last 30 years. Mr. Northam is now retired and trading the stock market full time. You can reach him at inquiry@tradersclassroom.com or by visiting his website at http://www.tradersclassroom.com. You can also follow him on Twitter @TradersClassrm.
PRINT THIS ARTICLE
STATISTICS
DJIA Diffusion Index Continues To Fall
03/25/11 01:16:40 PMby Alan R. Northam
The Dow Jones Industrial Average Diffusion Index indicates difficulty in the Dow pushing to new higher highs.
Position: N/A
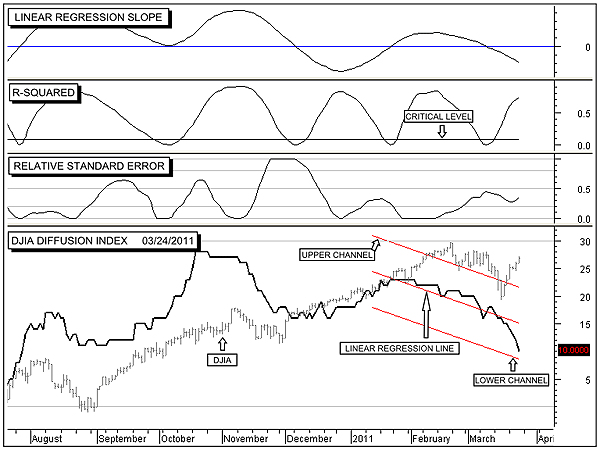
| The statistical diffusion index in Figure 1 represents the number of securities making up the Dow Jones Industrial Average (DJIA) and moves between zero and 30. The indicator measures the number of the Dow stocks in a strong intermediate-term uptrend by measuring the number of stocks whose 50-day linear regression slope indicator is above zero and whose 50-day R-squared indicator is above its critical level. The current reading of 10 indicates that only 10 of the stocks within the DJIA are still in strong uptrends. |
| From late September 2010 forward, the statistical diffusion index has been making lower lows and lower highs, indicating that the number of of DJIA stocks remaining in strong uptrends has been continuously shrinking, with only 10 stocks remaining in strong uptrends to carry the DJIA higher as shown in Figure 1. In Figure 1, I have shown the 50-day linear regression trendline along with its upper and lower two sigma channel lines. Note that the diffusion index is fast approaching the lower channel line that acts as support. Thus, we could see a bounce in the diffusion index in the days ahead. The possible bounce would most likely carry the diffusion index back to the linear regression trendline before resuming its downward slide. A break down below the lower channel line would indicate an acceleration in the number of DJIA stocks losing their strength. The DJIA is shown in the background for reference. |

|
| FIGURE 1: .DJI, DAILY. This chart shows the DJIA diffusion index in the bottom panel along with the 50-day linear regression trendline along with its upper and lower two sigma channel lines. The linear regression slope indicator is shown in the top panel, the R-squared indicator in the second panel, and the relative standard error index (RSEI) in the third. |
| Graphic provided by: MetaStock. |
| |
| The linear regression slope indicator in the top panel continues to point downward and does not show any signs of turning back upward. This is an indication that the diffusion index will continue to fall. The R-squared indicator is above 0.7, indicating a strong downtrend. This is also an indication that the diffusion index will continue to fall. However, I do detect that the indicator could be in the very early stage of turning. If this indicator does continue to turn, it will signal future weakness in the downtrend. A move below its critical value would then indicate the lack of a significant downtrend. The relative standard error Index (RSEI) remains below 0.5, indicating below average volatility. This also indicates that the downtrend in the diffusion index will most likely continue. However, with the RSEI above 0.2, it does suggest the possibility of a bounce as discussed. |
| In conclusion, the statistical analysis of the DJIA statistical diffusion index suggests that the DJIA continues to weaken. With only 10 stocks remaining in strong uptrends and the diffusion index continuing to fall, it becomes increasingly more difficult for the DJIA to push to new higher highs. |
Alan Northam lives in the Dallas, Texas area and as an electronic engineer gave him an analytical mind from which he has developed a thorough knowledge of stock market technical analysis. His abilities to analyze the future direction of the stock market has allowed him to successfully trade of his own portfolio over the last 30 years. Mr. Northam is now retired and trading the stock market full time. You can reach him at inquiry@tradersclassroom.com or by visiting his website at http://www.tradersclassroom.com. You can also follow him on Twitter @TradersClassrm.
| Garland, Tx | |
| Website: | www.tradersclassroom.com |
| E-mail address: | inquiry@tradersclassroom.com |
Click here for more information about our publications!
Comments

Request Information From Our Sponsors
- StockCharts.com, Inc.
- Candle Patterns
- Candlestick Charting Explained
- Intermarket Technical Analysis
- John Murphy on Chart Analysis
- John Murphy's Chart Pattern Recognition
- John Murphy's Market Message
- MurphyExplainsMarketAnalysis-Intermarket Analysis
- MurphyExplainsMarketAnalysis-Visual Analysis
- StockCharts.com
- Technical Analysis of the Financial Markets
- The Visual Investor
- VectorVest, Inc.
- Executive Premier Workshop
- One-Day Options Course
- OptionsPro
- Retirement Income Workshop
- Sure-Fire Trading Systems (VectorVest, Inc.)
- Trading as a Business Workshop
- VectorVest 7 EOD
- VectorVest 7 RealTime/IntraDay
- VectorVest AutoTester
- VectorVest Educational Services
- VectorVest OnLine
- VectorVest Options Analyzer
- VectorVest ProGraphics v6.0
- VectorVest ProTrader 7
- VectorVest RealTime Derby Tool
- VectorVest Simulator
- VectorVest Variator
- VectorVest Watchdog
