HOT TOPICS LIST
- MACD
- Fibonacci
- RSI
- Gann
- ADXR
- Stochastics
- Volume
- Triangles
- Futures
- Cycles
- Volatility
- ZIGZAG
- MESA
- Retracement
- Aroon
INDICATORS LIST
LIST OF TOPICS
PRINT THIS ARTICLE
by Mike Carr, CMT
Returns are never enough to determine whether a system idea is actually tradable.
Position: N/A
Mike Carr, CMT
Mike Carr, CMT, is a member of the Market Technicians Association, and editor of the MTA's newsletter, Technically Speaking. He is also the author of "Smarter Investing in Any Economy: The Definitive Guide to Relative Strength Investing," and "Conquering the Divide: How to Use Economic Indicators to Catch Stock Market Trends."
PRINT THIS ARTICLE
TRADING SYSTEMS
Simple Coffee Trading System Beats The S&P 500
03/25/11 01:04:39 PMby Mike Carr, CMT
Returns are never enough to determine whether a system idea is actually tradable.
Position: N/A
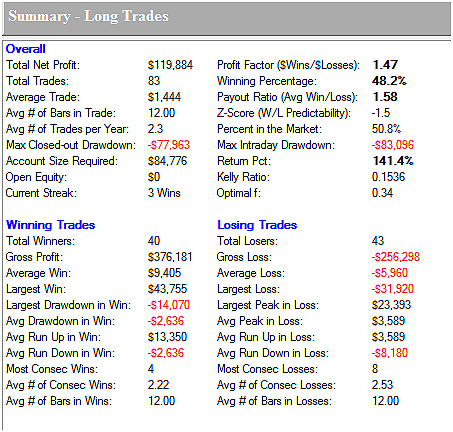
| While the title of this article reads like something from the junk mail you threw away today, a simple strategy based on the well-known moving average convergence/divergence (MACD) indicator can deliver stock market-beating results in the futures market, trading a single coffee contract. Based on the minimum margin of a little more than $4,000, coffee could be traded with a $5,000 account. Buy signals are given when the weekly MACD (with default settings of 12 and 26 weeks) turns positive and the position is held for 12 weeks. Annualized returns since 1975 are 9.23% per year for the futures contract, compared to 8.70% for the S&P 500 buy & hold index investor. This assumes no transaction costs or annual fees for the equity investor and a $45 slippage and commissions allowance per round-turn for the futures trader. The trading system summary results are shown in Figure 1. |

|
| FIGURE 1: SUMMARY, LONG TRADES. The trade summary shows the drawdown, a factor that traders need to consider before implementing a system. |
| Graphic provided by: Trade Navigator. |
| |
| Traders understand that the average annual return is only one factor to consider when designing a trading system. This is a measure of the largest loss the system endured during the historical test period. There is no guarantee that the future will be anything like the past, and traders should be ready for the worst future drawdown to be larger than the worst historical drawdown. Drawdown is probably more important to consider than profits since it is a tangible expression of risk. It is possible to see systems where the worst-case drawdown is greater than the total profits. |
| Using the MACD example shown, the total drawdown amounts to about 70% of the current system profits. Expressed another way, it is about 55% of the peak profits seen in the system history. This sounds high, but the buy & hold stock market investor experienced a drawdown of almost 60% in the Standard & Poor's 500 and more than 80% in the NASDAQ 100 since 2000. Trading always involves losses, and the level of losses can be higher than anyone would like to see. |
| Risk is very high in this simple strategy, as it is in any investment. Backtesting should be used to understand the general level of risk, and prudent traders need to expect that the greatest risk always lies in the future. In this case, the headline numbers sound intriguing, but digging deeper, we can see that risk may make it tough to stick with the strategy in bad times. It's best to think of this idea as a starting point for system development, and to measure risk in several ways before putting real money to work in the markets. It's also best to remember that past performance is no guarantee of future performance. |
Mike Carr, CMT, is a member of the Market Technicians Association, and editor of the MTA's newsletter, Technically Speaking. He is also the author of "Smarter Investing in Any Economy: The Definitive Guide to Relative Strength Investing," and "Conquering the Divide: How to Use Economic Indicators to Catch Stock Market Trends."
| Website: | www.moneynews.com/blogs/MichaelCarr/id-73 |
| E-mail address: | marketstrategist@gmail.com |
Click here for more information about our publications!
Comments
Date: 03/30/11Rank: 1Comment:

Request Information From Our Sponsors
- StockCharts.com, Inc.
- Candle Patterns
- Candlestick Charting Explained
- Intermarket Technical Analysis
- John Murphy on Chart Analysis
- John Murphy's Chart Pattern Recognition
- John Murphy's Market Message
- MurphyExplainsMarketAnalysis-Intermarket Analysis
- MurphyExplainsMarketAnalysis-Visual Analysis
- StockCharts.com
- Technical Analysis of the Financial Markets
- The Visual Investor
- VectorVest, Inc.
- Executive Premier Workshop
- One-Day Options Course
- OptionsPro
- Retirement Income Workshop
- Sure-Fire Trading Systems (VectorVest, Inc.)
- Trading as a Business Workshop
- VectorVest 7 EOD
- VectorVest 7 RealTime/IntraDay
- VectorVest AutoTester
- VectorVest Educational Services
- VectorVest OnLine
- VectorVest Options Analyzer
- VectorVest ProGraphics v6.0
- VectorVest ProTrader 7
- VectorVest RealTime Derby Tool
- VectorVest Simulator
- VectorVest Variator
- VectorVest Watchdog
