HOT TOPICS LIST
- MACD
- Fibonacci
- RSI
- Gann
- ADXR
- Stochastics
- Volume
- Triangles
- Futures
- Cycles
- Volatility
- ZIGZAG
- MESA
- Retracement
- Aroon
INDICATORS LIST
LIST OF TOPICS
PRINT THIS ARTICLE
by Koos van der Merwe
Here's a share that has given a buy signal as the market recovers.
Position: Buy
Koos van der Merwe
Has been a technical analyst since 1969, and has worked as a futures and options trader with First Financial Futures in Johannesburg, South Africa.
PRINT THIS ARTICLE
CUP WITH HANDLE
Is It Time To Buy Orthofix International?
03/23/11 08:23:58 AMby Koos van der Merwe
Here's a share that has given a buy signal as the market recovers.
Position: Buy
| Orthofix International is a diversified orthopedic products company offering a line of surgical and nonsurgical products for the spine, orthopedics, sports medicine, and vascular market sectors. |

|
| FIGURE 1: ORTHOFIX, MONTHLY |
| Graphic provided by: AdvancedGET. |
| |
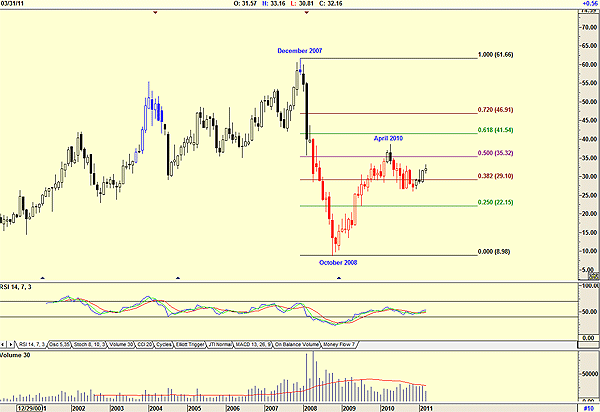
| Figure 1 is a monthly chart and shows how the price fell from a high of $61.66 in December 2007 to a low of $8.98 by October 2008. From that low, it started rising to reach a high of 35.32 by April 2010 as the NASDAQ recovered. At the moment, the chart shows that it is trading between the Fibonacci ratios of 38.2% and 50%. A move above $35.32, the 50% retracement level, suggests that it will test the $41.54 level, the 61.8% Fibonacci ratio. Note that the relative strength index (RSI) is showing strength. Volume, however, is below average. |

|
| FIGURE 2: ORTHOFIX, DAILY |
| Graphic provided by: AdvancedGET. |
| |
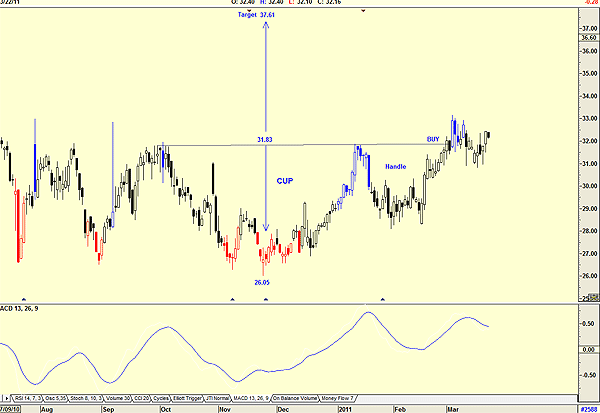
| Figure 2, a daily chart, shows that a cup-and-handle formation developed, suggesting a target of $37.61 (31.83 -26.05 = 5.78 + 31.83 = 37.61). The handle, as shown on the chart, has given a buy signal, soon to be confirmed by the moving average convergence/divergence (MACD) indicator as shown. |

|
| FIGURE 3: ORTHOFIX, OMNITRADER, DAILY |
| Graphic provided by: OmniTrader. |
| |
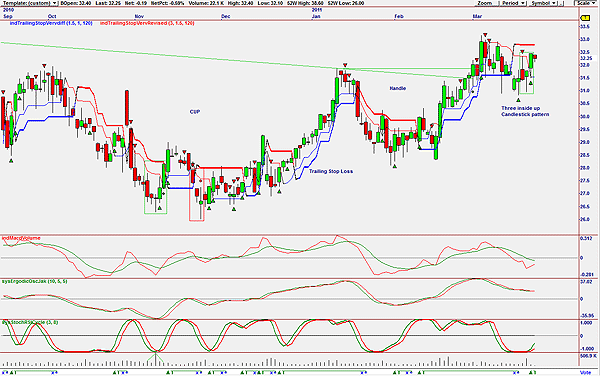
| Figure 3 shows that the vote line has given a buy signal. The indicators shown on the chart are as follows: 1. A three inside candlestick pattern suggesting a buy 2. The MACD volume indicator below the zero line and moving into a buy 3. Ergodic oscillator giving a v signal 4. RSI stochastic cycle oscillator giving a buy signal. With the market starting to recover from a strong correction, Orthofix suggests a buy. |
Has been a technical analyst since 1969, and has worked as a futures and options trader with First Financial Futures in Johannesburg, South Africa.
| Address: | 3256 West 24th Ave |
| Vancouver, BC | |
| Phone # for sales: | 6042634214 |
| E-mail address: | petroosp@gmail.com |
Click here for more information about our publications!
PRINT THIS ARTICLE

Request Information From Our Sponsors
- VectorVest, Inc.
- Executive Premier Workshop
- One-Day Options Course
- OptionsPro
- Retirement Income Workshop
- Sure-Fire Trading Systems (VectorVest, Inc.)
- Trading as a Business Workshop
- VectorVest 7 EOD
- VectorVest 7 RealTime/IntraDay
- VectorVest AutoTester
- VectorVest Educational Services
- VectorVest OnLine
- VectorVest Options Analyzer
- VectorVest ProGraphics v6.0
- VectorVest ProTrader 7
- VectorVest RealTime Derby Tool
- VectorVest Simulator
- VectorVest Variator
- VectorVest Watchdog
- StockCharts.com, Inc.
- Candle Patterns
- Candlestick Charting Explained
- Intermarket Technical Analysis
- John Murphy on Chart Analysis
- John Murphy's Chart Pattern Recognition
- John Murphy's Market Message
- MurphyExplainsMarketAnalysis-Intermarket Analysis
- MurphyExplainsMarketAnalysis-Visual Analysis
- StockCharts.com
- Technical Analysis of the Financial Markets
- The Visual Investor
