

HOT TOPICS LIST
- MACD
- Fibonacci
- RSI
- Gann
- ADXR
- Stochastics
- Volume
- Triangles
- Futures
- Cycles
- Volatility
- ZIGZAG
- MESA
- Retracement
- Aroon
INDICATORS LIST
LIST OF TOPICS
PRINT THIS ARTICLE
by Billy Williams
Mid-March has historically given in to weakness in the overall market, but if you know how to look for the strongest stocks, you can profit when the market turns up.
Position: Buy
Billy Williams
Billy Williams has been trading the markets for 27 years, specializing in momentum trading with stocks and options.
PRINT THIS ARTICLE
STATISTICS
Identifying Strong Stocks In Mid-March Weakness
03/22/11 08:27:01 AMby Billy Williams
Mid-March has historically given in to weakness in the overall market, but if you know how to look for the strongest stocks, you can profit when the market turns up.
Position: Buy
| While there appears to be some strain in the market's advance, there is, fortunately, some light at the end of the tunnel. However, March has historically proven to be a month that is a bit of Dr. Jekyll and Mr. Hyde where mid-month strength has turned to end-of-month weakness, according to this year's report in the "Stock Trader's Almanac." This has proved true to traders that had gone forward at the beginning of this March and hoped that it would resume its upward move, but instead, traders have seen it roll over to the downside, showing weakness and leaving many wondering what now to do. According to the "Stock Trader's Almanac 2011," March has taken some blows going into the end of its first quarter on a historical basis, losing a combined 1469 Dow points March 9 to 22, 2011. |
| However, investors should feel a little more secure in the fact that 2011 is a pre-Presidential election year, which has never had a losing year in the last 72 years. This statistic is a positive for bulls going into 2011, offering the chance to select the most ideal stocks that will benefit from these historical patterns as well as from their own strong potential for gains. A key factor in high-performing stocks is the relative strength ranking (RS) that a stock is scored with in rating its performance. RS is one of the most important, if not the most important, indicator of a stock's performance as well as its future performance. See Figure 1. |
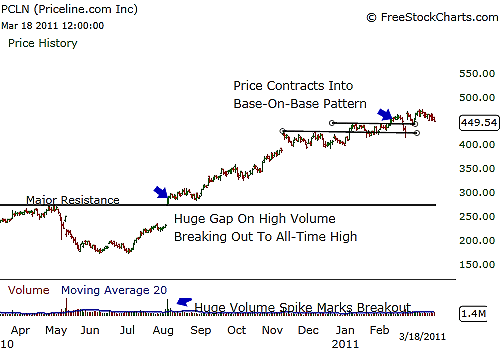
|
| FIGURE 1: PCLN. PCLN was on a strong bull run until the overall market starting selling off, but still, PLCN trades near its high despite the downturn, revealing high relative strength and the potential to lead the next bull run in the market. |
| Graphic provided by: www.freestockcharts.com. |
| |
| Ranked between zero to 100, with zero being the weakest and 100 being the strongest, RS is determined on a comparative basis to the overall market. For example, if a stock has an RS of 80, then that means that it is performing as well as 80% of the stocks that make up the market. According to Mark Boucher, hedge fund manager and author of "The Hedge Fund Edge," you want to buy strength where there is still room for strong upside potential by investing in stocks with the highest RS ranking, because in doing so, you will position yourself in the strongest trends. During a market down, identifying the high RS stocks during a correction, pullback, or selloff will offer you the opportunity to enter into the stocks that will emerge as stock market leaders. |
| During a downturn in the market, a high RS stock that will emerge a potential leader in the next stock market bull run will likely be lingering near or at its all-time high or, at the very least, its 52-week high while forming a base or chart pattern. It is precisely these times when technical analysis will confirm your entry as it gains momentum and trades upward, leading the next bull run in the stock market and taking it higher. |
| Look for stocks with high RS and whose price action is trading in a definable range on low volume or a chart pattern that is setting up. You will notice that these stocks have a tendency to break out higher just before the market turns up, and the reason for that is because they typically move first, taking the market higher after the fact. You can enter the stock as it makes its move to the upside and confirming it with volume or wait for a pause in the stock's price action to enter on a pullback. |
Billy Williams has been trading the markets for 27 years, specializing in momentum trading with stocks and options.
| Company: | StockOptionSystem.com |
| E-mail address: | stockoptionsystem.com@gmail.com |
Traders' Resource Links | |
| StockOptionSystem.com has not added any product or service information to TRADERS' RESOURCE. | |
Click here for more information about our publications!
PRINT THIS ARTICLE

Request Information From Our Sponsors
- StockCharts.com, Inc.
- Candle Patterns
- Candlestick Charting Explained
- Intermarket Technical Analysis
- John Murphy on Chart Analysis
- John Murphy's Chart Pattern Recognition
- John Murphy's Market Message
- MurphyExplainsMarketAnalysis-Intermarket Analysis
- MurphyExplainsMarketAnalysis-Visual Analysis
- StockCharts.com
- Technical Analysis of the Financial Markets
- The Visual Investor
- VectorVest, Inc.
- Executive Premier Workshop
- One-Day Options Course
- OptionsPro
- Retirement Income Workshop
- Sure-Fire Trading Systems (VectorVest, Inc.)
- Trading as a Business Workshop
- VectorVest 7 EOD
- VectorVest 7 RealTime/IntraDay
- VectorVest AutoTester
- VectorVest Educational Services
- VectorVest OnLine
- VectorVest Options Analyzer
- VectorVest ProGraphics v6.0
- VectorVest ProTrader 7
- VectorVest RealTime Derby Tool
- VectorVest Simulator
- VectorVest Variator
- VectorVest Watchdog