HOT TOPICS LIST
- MACD
- Fibonacci
- RSI
- Gann
- ADXR
- Stochastics
- Volume
- Triangles
- Futures
- Cycles
- Volatility
- ZIGZAG
- MESA
- Retracement
- Aroon
INDICATORS LIST
LIST OF TOPICS
PRINT THIS ARTICLE
by Billy Williams
Selloffs can sometimes seem to come suddenly, but if you know two key concepts to spot distribution, you can protect yourself and still profit.
Position: Sell
Billy Williams
Billy Williams has been trading the markets for 27 years, specializing in momentum trading with stocks and options.
PRINT THIS ARTICLE
VOLUME
Two Key Factors In Spotting Distributions
03/21/11 09:26:00 AMby Billy Williams
Selloffs can sometimes seem to come suddenly, but if you know two key concepts to spot distribution, you can protect yourself and still profit.
Position: Sell
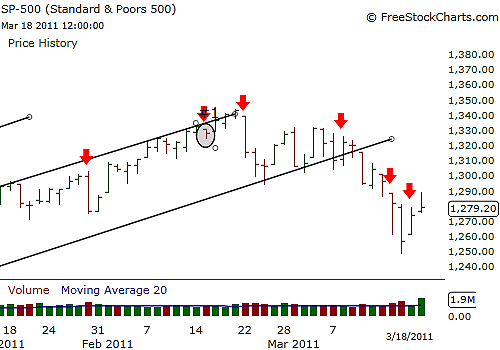
| Since its bottom in late August 2010, the Standard & Poor's 500 (SPX) has been on a steady climb higher but now, can its bullish trend be called into doubt? And, more importantly, how do you determine if this is a normal pullback, correction, or price crash? Price and volume activity can help determine when distribution is taking place if you understand what to look for and then act accordingly to adjust for any volatile selloff. Volume is the rocket fuel of the stock market; if the stock market is going up on high volume then the market is under accumulation. This can be reflected in the rising buying volume of the SPX in Figure 1. Conversely, if the market is under distribution, then that too is reflected in the rising selling volume of the SPX. |
| Distribution days can be spotted in one of two ways. When the SPX is down more than 1% of its daily range from yesterday's closing price and on higher trade volume from the previous day, then it is considered a distribution day. That is, sellers took control of the day's trade action and forced the market down. The second method is spotting days where price opens and closes near or at the same price on higher volume. These are also distribution days where sellers sell into the buying action but the day opens and closes neutral. These distribution days are harder to spot and professional traders know that; institutions try to mask their liquidation of a big position as best they can so as to not alert other traders what they're doing in order to sell off at the best price possible (see Figure 1). |

|
| FIGURE 1: S&P 500. Over the last several weeks, the SPX has registered several distribution days that have led up to the market selling off and breaking major support in the form of a long-term trendline. At point 1, this narrow daily bar closed down near its opening price on greater volume than the previous day, confirming it as a distribution day. |
| Graphic provided by: www.freestockcharts.com. |
| |
| When the market accumulates for five or six distribution days within a six-week period, it reveals pinpricks within the strength of the current bullish trend in price. Over time, it could materialize into a correction or crash. Here is the tricky part -- tops in the stock market are notoriously difficult to time. A market that has been under accumulation for a long time (like the current market) can continue to go up either on momentum or late buyers who double down their position to avoid taking a loss. This forces the market up to artificial levels. Once this happens, the selloff is more severe and greater losses can occur if you're not prepared. |
| When distribution days begin to mount up, as detailed here, it should be taken as a red light or warning signal to tighten up your stops, take partial profits, or sell off your position entirely. You can also use technical analysis by looking for any breaks in the index's long-term trendline as the final signal to exit your position. |
| The important thing to do is to have a plan in place if the market sells off suddenly. Most traders are great at entering the market at the right time but horrible at getting out when it's called for. This can result in all their gains being wiped out in a massive sell-off or, worse, taking a loss when it could have been avoided. Remember, when you're ahead in a position, the money is made in the selling and, more importantly, at the right time. Knowing how to spot distribution days can help you determine when that time is and avoid needless losses. |
Billy Williams has been trading the markets for 27 years, specializing in momentum trading with stocks and options.
| Company: | StockOptionSystem.com |
| E-mail address: | stockoptionsystem.com@gmail.com |
Traders' Resource Links | |
| StockOptionSystem.com has not added any product or service information to TRADERS' RESOURCE. | |
Click here for more information about our publications!
Comments
Date: 03/22/11Rank: 3Comment:
Date: 03/22/11Rank: 4Comment:

Request Information From Our Sponsors
- VectorVest, Inc.
- Executive Premier Workshop
- One-Day Options Course
- OptionsPro
- Retirement Income Workshop
- Sure-Fire Trading Systems (VectorVest, Inc.)
- Trading as a Business Workshop
- VectorVest 7 EOD
- VectorVest 7 RealTime/IntraDay
- VectorVest AutoTester
- VectorVest Educational Services
- VectorVest OnLine
- VectorVest Options Analyzer
- VectorVest ProGraphics v6.0
- VectorVest ProTrader 7
- VectorVest RealTime Derby Tool
- VectorVest Simulator
- VectorVest Variator
- VectorVest Watchdog
- StockCharts.com, Inc.
- Candle Patterns
- Candlestick Charting Explained
- Intermarket Technical Analysis
- John Murphy on Chart Analysis
- John Murphy's Chart Pattern Recognition
- John Murphy's Market Message
- MurphyExplainsMarketAnalysis-Intermarket Analysis
- MurphyExplainsMarketAnalysis-Visual Analysis
- StockCharts.com
- Technical Analysis of the Financial Markets
- The Visual Investor
