HOT TOPICS LIST
- MACD
- Fibonacci
- RSI
- Gann
- ADXR
- Stochastics
- Volume
- Triangles
- Futures
- Cycles
- Volatility
- ZIGZAG
- MESA
- Retracement
- Aroon
INDICATORS LIST
LIST OF TOPICS
PRINT THIS ARTICLE
by Andrew Hetherington
There are always patterns within patterns. Network Appliance Inc. (NTAP) is a classic example of this situation. This exquisite illustration demonstrates the pitfalls and the potential rewards of one such situation.
Position: N/A
Andrew Hetherington
Classic Dow Theorist who trades as a pure technician, using pattern recognition.
PRINT THIS ARTICLE
TECHNICAL ANALYSIS
Patterns Within Patterns
02/26/02 01:54:16 PMby Andrew Hetherington
There are always patterns within patterns. Network Appliance Inc. (NTAP) is a classic example of this situation. This exquisite illustration demonstrates the pitfalls and the potential rewards of one such situation.
Position: N/A
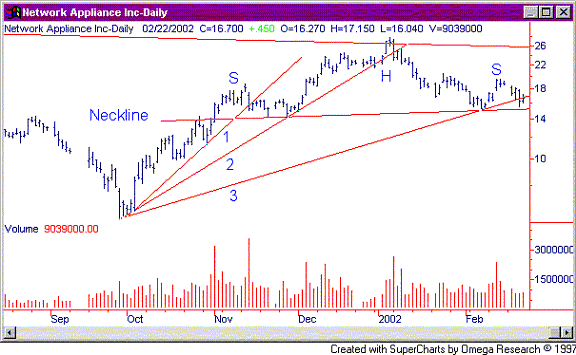
| Figure 1 shows Network Appliance forming a very nice, near-perfect head and shoulders top reversal pattern. It has the higher volume going from left to right, starting with the left shoulder. It's the high volume left shoulders that are perfect head and shoulders top patterns. These types of spiking left shoulders are my preference when I short, based on this style of pattern, along with an upsloping neckline. It illustrates a shrinking demand. In comparison there are many examples with higher volume on the head but I find this type to be more dependable. It's all about reducing your risk and making a higher percentage choice. In addition to the pattern there is a third fan line breach which, given a few extra days, will turn out to be a break. Naturally, this is speculative at this point but a breach can be an early warning. |
| My expectations are for the general market condition to help push this one down. It is already weak and there only needs to be a catalyst. A move down to the $12.00 area or lower is likely. I wouldn't expect a move higher than $18.00, so if it moves up slightly from $16.70 it would be an excellent opportunity to sell short and wait. |

|
| Figure 1: Daily chart for Network Appliance Inc. (NTAP) |
| Graphic provided by: SuperCharts. |
| |
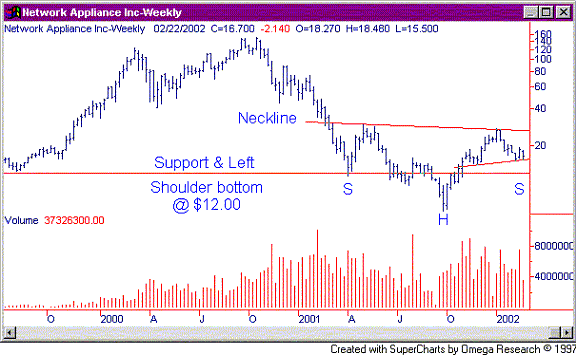
| In Figure 2 another head and shoulders pattern is developing. This is a bottom reversal. So, we have a bearish pattern within a much larger bullish pattern. The tendency towards symmetry on the shoulders suggests that the down move will have trouble going much lower than the left shoulder in the $12.00 area. Of course, this pattern is not yet complete but it does look as if it will do so. This is the reason not to let greed hinder your profit potential. If or when it turns upwards, it will likely have spiking volume accompany the rise in price. This can erode your profits very quickly. The bearish head and shoulders pattern on what will be the right shoulder of the bullish head and shoulders is a typical illustration of the pitfalls and the profit potential. My suggestion is to play it short then go long at the bottom of the right shoulder. Patterns often occur within patterns, but this one has a caveat if you play it short. |
 Figure 2: Weekly chart for Network Appliance Inc. (NTAP) |
Classic Dow Theorist who trades as a pure technician, using pattern recognition.
| Toronto, Canada |
Click here for more information about our publications!
Comments
Date: 02/26/02Rank: 4Comment:
Date: 02/26/02Rank: 5Comment: Intel: (INTC)
5th fan line at 29.50.
Completed pullback to the neckline yesterday and today (25th 26th).
May want to stop around 26.00, then maybe 22.00.
TS
Date: 02/28/02Rank: 5Comment:
Date: 03/04/02Rank: 4Comment:
Date: 03/05/02Rank: 1Comment:

Request Information From Our Sponsors
- StockCharts.com, Inc.
- Candle Patterns
- Candlestick Charting Explained
- Intermarket Technical Analysis
- John Murphy on Chart Analysis
- John Murphy's Chart Pattern Recognition
- John Murphy's Market Message
- MurphyExplainsMarketAnalysis-Intermarket Analysis
- MurphyExplainsMarketAnalysis-Visual Analysis
- StockCharts.com
- Technical Analysis of the Financial Markets
- The Visual Investor
- VectorVest, Inc.
- Executive Premier Workshop
- One-Day Options Course
- OptionsPro
- Retirement Income Workshop
- Sure-Fire Trading Systems (VectorVest, Inc.)
- Trading as a Business Workshop
- VectorVest 7 EOD
- VectorVest 7 RealTime/IntraDay
- VectorVest AutoTester
- VectorVest Educational Services
- VectorVest OnLine
- VectorVest Options Analyzer
- VectorVest ProGraphics v6.0
- VectorVest ProTrader 7
- VectorVest RealTime Derby Tool
- VectorVest Simulator
- VectorVest Variator
- VectorVest Watchdog
