HOT TOPICS LIST
- MACD
- Fibonacci
- RSI
- Gann
- ADXR
- Stochastics
- Volume
- Triangles
- Futures
- Cycles
- Volatility
- ZIGZAG
- MESA
- Retracement
- Aroon
INDICATORS LIST
LIST OF TOPICS
PRINT THIS ARTICLE
by Matt Blackman
On March 17, the Federal Reserve Bank of Cleveland reported its 10-year expected inflation rate of 1.88%. What does that mean? The bank expects that the consumer price inflation rate will average less than 2% over the next decade. What if they're wrong?
Position: N/A
Matt Blackman
Matt Blackman is a full-time technical and financial writer and trader. He produces corporate and financial newsletters, and assists clients in getting published in the mainstream media. He is the host of TradeSystemGuru.com. Matt has earned the Chartered Market Technician (CMT) designation. Find out what stocks and futures Matt is watching on Twitter at www.twitter.com/RatioTrade
PRINT THIS ARTICLE
FUNDS CASH
Getting Real On Inflation
03/18/11 08:57:13 AMby Matt Blackman
On March 17, the Federal Reserve Bank of Cleveland reported its 10-year expected inflation rate of 1.88%. What does that mean? The bank expects that the consumer price inflation rate will average less than 2% over the next decade. What if they're wrong?
Position: N/A
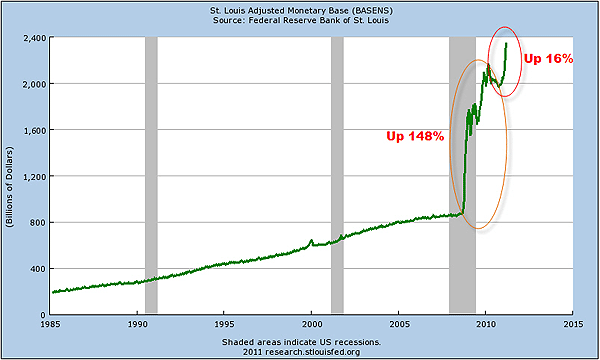
| According to the latest Federal Reserve numbers, the median Consumer Price Index rose just 0.2% in February, which works out to an annualized rate of 2.4% after seasonal adjustments. Fed statements have consistently downplayed inflation pressure and have instead stressed concern for deflation. Certainly their actions would support this concern, as the first chart of the adjusted monetary base shows (Figure 1). |

|
| FIGURE 1. Biweekly chart of the adjusted monetary base (not seasonally adjusted) showing the incredible pump from the Fed of the money in circulation. |
| Graphic provided by: St. Louis Federal Reserve. |
| |
| As of the second week in March, there was 160% more money in circulation than there was in September 2008 and even with trillions of dollars injected into the money supply, inflation has remained muted, if you believe the Federal Reserve. However, other inflation measures show a different picture. According to the latest data from Massachusetts Institute of Technology's Billion Prices Project, which measures prices at thousands of stores and outlets across the country and around the world, the annual inflation rate is close to 3%, compared to the CPI annual estimate of 1.63%. Other inflation measures, especially those that use food and fuel, are higher. |

|
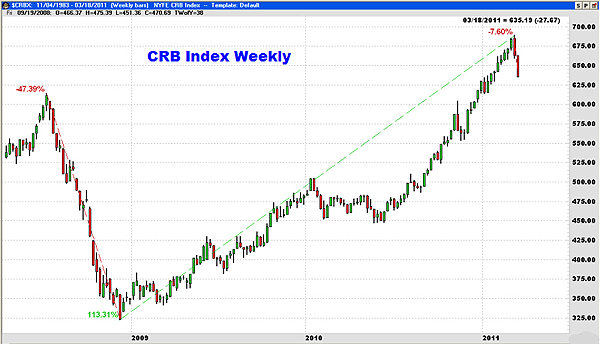
| FIGURE 2. Here's the weekly chart of the NYFE CRB Index over the last two years showing the 47% drop in 2008 followed by the surge of 113% in 2009 through 2011 and correction in March 2011. |
| Graphic provided by: Genesis Software. |
| |
| According to the Purchasers Price Finished Consumer Foods Index (PPI-FCFI), the index rose 3.9% in February, which works out to an annualized increase of 58%! This is the largest jump since 1974. Prices for finished goods have jumped 5.6% over the last year, according to the Producer Price Index. Food and energy components jumped 3.9% and 3.3%, respectively, in February alone. Those who were around in the 1970s remember it as a period of unprecedented inflation that eventually pushed the price of gold from $35/oz in 1971 to more than $800/oz by 1980 with an economy mired in stagflation that lasted into the early 1980s. |
| Given this and other evidence, inflation pressure is clearly growing far more than government sources are prepared to admit. Stagflation, in which inflation and economic stagnation occur simultaneously, is very different than deflation, which causes price declines across sectors. Trading and investing strategies are also very different. |
| If this is the case, expect more of what we have been experiencing with resilient commodity prices, especially energy and metals and a weak employment market. Sectors that benefit from this type of inflation include resource companies, food producers, and mining companies. Perhaps more significantly, interest rates have the potential to rise much faster once the economy does mend than would occur in a deflationary environment. I will be exploring this topic in greater detail in an upcoming Working Money article. |
Matt Blackman is a full-time technical and financial writer and trader. He produces corporate and financial newsletters, and assists clients in getting published in the mainstream media. He is the host of TradeSystemGuru.com. Matt has earned the Chartered Market Technician (CMT) designation. Find out what stocks and futures Matt is watching on Twitter at www.twitter.com/RatioTrade
| Company: | TradeSystemGuru.com |
| Address: | Box 2589 |
| Garibaldi Highlands, BC Canada | |
| Phone # for sales: | 604-898-9069 |
| Fax: | 604-898-9069 |
| Website: | www.tradesystemguru.com |
| E-mail address: | indextradermb@gmail.com |
Traders' Resource Links | |
| TradeSystemGuru.com has not added any product or service information to TRADERS' RESOURCE. | |
Click here for more information about our publications!
PRINT THIS ARTICLE

Request Information From Our Sponsors
- StockCharts.com, Inc.
- Candle Patterns
- Candlestick Charting Explained
- Intermarket Technical Analysis
- John Murphy on Chart Analysis
- John Murphy's Chart Pattern Recognition
- John Murphy's Market Message
- MurphyExplainsMarketAnalysis-Intermarket Analysis
- MurphyExplainsMarketAnalysis-Visual Analysis
- StockCharts.com
- Technical Analysis of the Financial Markets
- The Visual Investor
- VectorVest, Inc.
- Executive Premier Workshop
- One-Day Options Course
- OptionsPro
- Retirement Income Workshop
- Sure-Fire Trading Systems (VectorVest, Inc.)
- Trading as a Business Workshop
- VectorVest 7 EOD
- VectorVest 7 RealTime/IntraDay
- VectorVest AutoTester
- VectorVest Educational Services
- VectorVest OnLine
- VectorVest Options Analyzer
- VectorVest ProGraphics v6.0
- VectorVest ProTrader 7
- VectorVest RealTime Derby Tool
- VectorVest Simulator
- VectorVest Variator
- VectorVest Watchdog
