HOT TOPICS LIST
- MACD
- Fibonacci
- RSI
- Gann
- ADXR
- Stochastics
- Volume
- Triangles
- Futures
- Cycles
- Volatility
- ZIGZAG
- MESA
- Retracement
- Aroon
INDICATORS LIST
LIST OF TOPICS
PRINT THIS ARTICLE
by Donald W. Pendergast, Jr.
Yes, it does look like the big, bad bear is back -- for a while, anyway. But even a bear market can offer some surprising, bullish bounces back to resistance areas.
Position: N/A
Donald W. Pendergast, Jr.
Donald W. Pendergast is a financial markets consultant who offers specialized services to stock brokers and high net worth individuals who seek a better bottom line for their portfolios.
PRINT THIS ARTICLE
SUPPORT & RESISTANCE
Computer Associates Looking To Bounce?
03/17/11 12:39:26 PMby Donald W. Pendergast, Jr.
Yes, it does look like the big, bad bear is back -- for a while, anyway. But even a bear market can offer some surprising, bullish bounces back to resistance areas.
Position: N/A
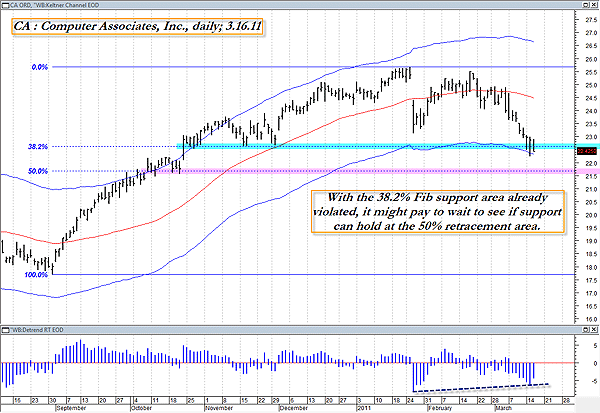
| Computer Associates (CA) has definitely turned southward, a directional choice made more plain by the negative price action occurring in the wake of last month's failed retest of the January 2011 high at $25.68. The stock is now at or near critical support levels, from which a bounce higher (degree unknown) might occur. Here's a quick look at CA's daily chart to see if there are any ways to play this current technical scenario (Figure 1). |

|
| FIGURE 1: CA, DAILY. With the first logical support zone already giving way, patient traders might be better served to see if a reversal can take hold at or near the Fibonacci 50% retracement zone (pink shaded area on chart). |
| Graphic provided by: MetaStock. |
| Graphic provided by: WB Detrend RT EOD from ProfitTrader for MetaStock. |
| |
| This stock was located by running MetaStock Explorer's Deel Oversold Reversal screen on all of the Standard & Poor's 500 index component stocks. After applying one set of Keltner channels (set at 4.25 standard deviations away from a 45-period exponential moving average [EMA]), a Fibonacci retracement grid and a WB detrend RT EOD oscillator, you come up with what is displayed in Figure 1. You'll note that the stock has mildly penetrated the 38.2% retracement of the August to January major price swing and is now toying with the lower Keltner channel line. One key to success with this particular exploration is to let the stock finally bottom out and then reverse higher before actually taking a countertrend long entry. That hasn't happened yet and there is a good possibility that shares of CA will want to complete a full 50% retracement before even considering a bounce higher toward resistance. The detrend oscillator is giving some hints of a bullish price/momentum divergence, but it's still too early to tell which way things will play out here. |
| One possible way to play the move south in CA is to hold out for the full 50% pullback (pink shaded area on chart near $21.60), wait for a bullish, wide range reversal bar and then sell an out-of-the-money put option with no more than four to eight weeks' worth of time value remaining. You may wish to investigate various April and/or May 2001 puts at strike prices of $20 and $21 for this purpose; any positive news coming out of Japan, Libya, or even the Middle East could help provoke a sharp multiday relief rally, so you want to get your shopping list ready before that happens. As with most short option plays, the idea is to close the short puts out (buy them back) as soon as you can after the first reasonably good swing in the desired direction, taking the profits sooner rather than later, lest an unexpected market turn transform a nice winning trade into a sorry loser. Stock traders can use the same support zone (pink shaded area) to begin looking for decent bottom reversal patterns on CA's 15- to 30-minute intraday charts. As with the option play, it's usually better to plan on an exit sooner rather than later, especially when considered in the context of a broad market that appears to be primed for a intermediate-term bear market. Nevertheless, there's no reason for skilled traders to miss out on the inevitable relief rallies that are bound to occur from time to time. |
Donald W. Pendergast is a financial markets consultant who offers specialized services to stock brokers and high net worth individuals who seek a better bottom line for their portfolios.
| Title: | Writer, market consultant |
| Company: | Linear Trading Systems LLC |
| Jacksonville, FL 32217 | |
| Phone # for sales: | 904-239-9564 |
| E-mail address: | lineartradingsys@gmail.com |
Traders' Resource Links | |
| Linear Trading Systems LLC has not added any product or service information to TRADERS' RESOURCE. | |
Click here for more information about our publications!
PRINT THIS ARTICLE

Request Information From Our Sponsors
- StockCharts.com, Inc.
- Candle Patterns
- Candlestick Charting Explained
- Intermarket Technical Analysis
- John Murphy on Chart Analysis
- John Murphy's Chart Pattern Recognition
- John Murphy's Market Message
- MurphyExplainsMarketAnalysis-Intermarket Analysis
- MurphyExplainsMarketAnalysis-Visual Analysis
- StockCharts.com
- Technical Analysis of the Financial Markets
- The Visual Investor
- VectorVest, Inc.
- Executive Premier Workshop
- One-Day Options Course
- OptionsPro
- Retirement Income Workshop
- Sure-Fire Trading Systems (VectorVest, Inc.)
- Trading as a Business Workshop
- VectorVest 7 EOD
- VectorVest 7 RealTime/IntraDay
- VectorVest AutoTester
- VectorVest Educational Services
- VectorVest OnLine
- VectorVest Options Analyzer
- VectorVest ProGraphics v6.0
- VectorVest ProTrader 7
- VectorVest RealTime Derby Tool
- VectorVest Simulator
- VectorVest Variator
- VectorVest Watchdog
