HOT TOPICS LIST
- MACD
- Fibonacci
- RSI
- Gann
- ADXR
- Stochastics
- Volume
- Triangles
- Futures
- Cycles
- Volatility
- ZIGZAG
- MESA
- Retracement
- Aroon
INDICATORS LIST
LIST OF TOPICS
PRINT THIS ARTICLE
by Chaitali Mohile
The gap up failed to build a bullish path for Dell. The stock is stuck in a tight range.
Position: Hold
Chaitali Mohile
Active trader in the Indian stock markets since 2003 and a full-time writer. Trading is largely based upon technical analysis.
PRINT THIS ARTICLE
GAPS
Dell Shows High Volatility
03/17/11 12:06:29 PMby Chaitali Mohile
The gap up failed to build a bullish path for Dell. The stock is stuck in a tight range.
Position: Hold
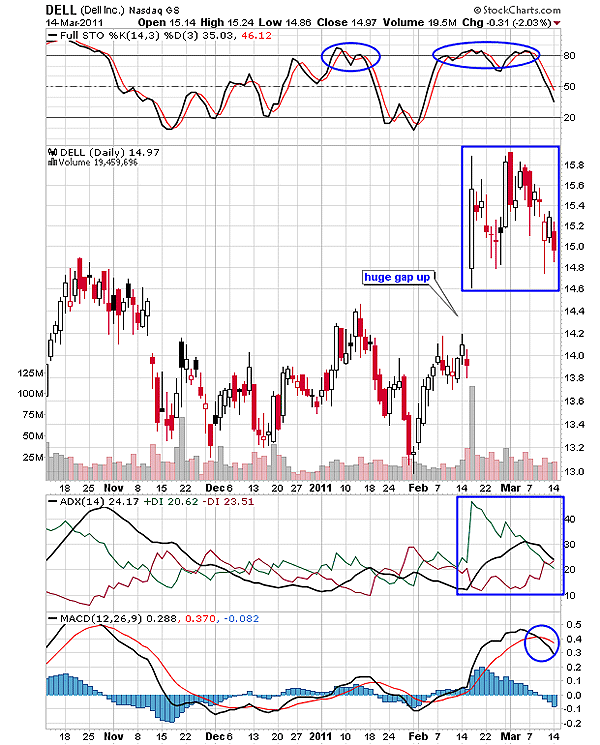
| A reversing overheated uptrend induced high bearish pressure in Dell (DELL). The stock began descending, and the increasing selling force resulted in a small gap down in November 2010. DELL formed an intermediate bottom at 13.2 levels, protecting the price rally from the further damage. With this support (13.2) as seen in Figure 1, the stock surged a few points, filling the gap formed earlier. However, the weak trend indicated by the average directional index (ADX) (14) and the unstable overbought full stochastic (14,3,3) discouraged the relief rally. Thus, DELL resumed its prior bearish path, forming a new low at the 13 level. |

|
| FIGURE 1: DELL, DAILY |
| Graphic provided by: StockCharts.com. |
| |
| Thereafter, the stock again tried to surge, regaining its bullish strength from the indicators. The jittery ADX (14), the stochastic oscillator, and the moving average convergence/divergence (MACD) (12,26,9) shifted into a bullish zone. Gradually, the previous gap down resistance was breached by a huge gap up. We can see in Figure 1 that a fresh breakout started. The large white candle with lower and upper shadows offered an attractive trading opportunity. The candle covered the distance of almost $1. The shadows formed robust support-resistance levels for DELL. The price rallied from the upper shadow to the lower shadow and vice versa. As such, the stock should have rushed higher after the gap up breakout, but the price was stuck in a tight range. |
| The uncertainty during the consolidation increased as the three bullish indicators began descending from the bullish areas. The ADX (14) was not overheated, yet the developing uptrend turned down. The momentum oscillator topped at 80 levels and took a nosedive below 60 levels. In addition, the moving average convergence/divergence (MACD) (12,26,9) formed a bearish crossover in positive territory. The bearish candles, doji candlesticks, highlighted huge volatility, which is likely to increase due to the robust bearish pressure. In the next few sessions, DELL could breach the lower consolidation range to fill the gap while undergoing volatile consolidation. |

|
| FIGURE 2: DELL, HOURLY |
| Graphic provided by: StockCharts.com. |
| |
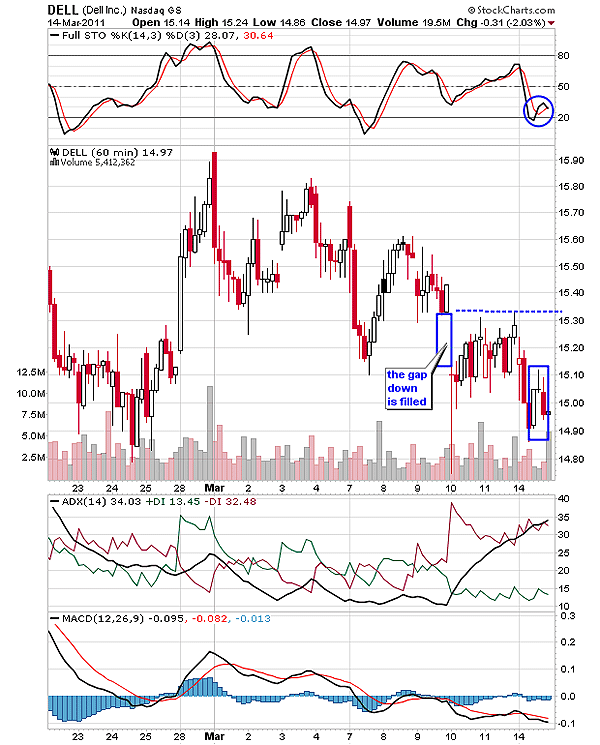
| For intraday traders, the hourly chart in Figure 2 would help trigger the right trade. After refilling the gap down of March 10, DELL has slipped downward. The stochastic oscillator is ready to retrace at an oversold level (20 levels), suggesting more downside rally. The ADX (14) is indicating a developing downtrend, and an evening star candlestick pattern would strengthen the bearish hold. Therefore, those holding short positions can continue to keep their positions open till the stock shows signs of reversal. |
Active trader in the Indian stock markets since 2003 and a full-time writer. Trading is largely based upon technical analysis.
| Company: | Independent |
| Address: | C1/3 Parth Indraprasth Towers. Vastrapur |
| Ahmedabad, Guj 380015 | |
| E-mail address: | chaitalimohile@yahoo.co.in |
Traders' Resource Links | |
| Independent has not added any product or service information to TRADERS' RESOURCE. | |
Click here for more information about our publications!
PRINT THIS ARTICLE

Request Information From Our Sponsors
- StockCharts.com, Inc.
- Candle Patterns
- Candlestick Charting Explained
- Intermarket Technical Analysis
- John Murphy on Chart Analysis
- John Murphy's Chart Pattern Recognition
- John Murphy's Market Message
- MurphyExplainsMarketAnalysis-Intermarket Analysis
- MurphyExplainsMarketAnalysis-Visual Analysis
- StockCharts.com
- Technical Analysis of the Financial Markets
- The Visual Investor
- VectorVest, Inc.
- Executive Premier Workshop
- One-Day Options Course
- OptionsPro
- Retirement Income Workshop
- Sure-Fire Trading Systems (VectorVest, Inc.)
- Trading as a Business Workshop
- VectorVest 7 EOD
- VectorVest 7 RealTime/IntraDay
- VectorVest AutoTester
- VectorVest Educational Services
- VectorVest OnLine
- VectorVest Options Analyzer
- VectorVest ProGraphics v6.0
- VectorVest ProTrader 7
- VectorVest RealTime Derby Tool
- VectorVest Simulator
- VectorVest Variator
- VectorVest Watchdog
