HOT TOPICS LIST
- MACD
- Fibonacci
- RSI
- Gann
- ADXR
- Stochastics
- Volume
- Triangles
- Futures
- Cycles
- Volatility
- ZIGZAG
- MESA
- Retracement
- Aroon
INDICATORS LIST
LIST OF TOPICS
PRINT THIS ARTICLE
by Koos van der Merwe
In all my years of studying Elliott wave charts, I have come across the following wave count variation a number of times.
Position: Buy
Koos van der Merwe
Has been a technical analyst since 1969, and has worked as a futures and options trader with First Financial Futures in Johannesburg, South Africa.
PRINT THIS ARTICLE
ELLIOTT WAVE
An Elliott Wave Variation
03/17/11 08:34:39 AMby Koos van der Merwe
In all my years of studying Elliott wave charts, I have come across the following wave count variation a number of times.
Position: Buy
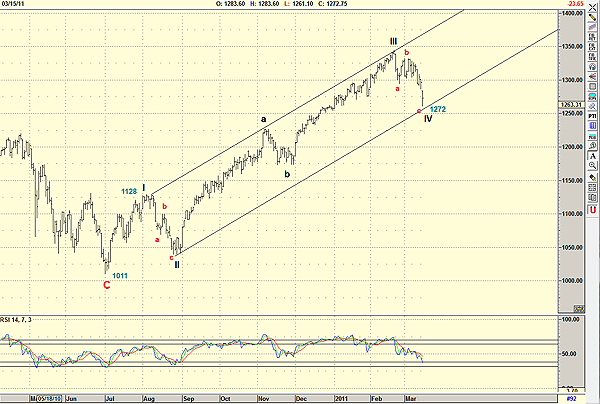
| After writing the previous article about the Standard & Poor's 500, I thought I would have a look at a bar chart rather than a candlestick chart. When I did this, the a-b pattern within a wave 3 hit me. This is a pattern I often saw when I was a chartist in South Africa, a pattern I have rarely seen in the US market. The pattern is not found in "The Elliott Wave Principle" by Robert Prechter. I did mention this pattern when I wrote an article about Elliott wave theory for STOCKS & COMMODITIES magazine. |

|
| FIGURE 1: S&P 500 BAR CHART |
| Graphic provided by: AdvancedGET. |
| |
| In Figure 1, note that the a-b correction is close to the middle of wave III. Note also that the current correction is testing the support line drawn from the low of wave II. Once again, note that the relative strength index (RSI) is close to giving a buy signal. The beauty of this Elliott wave count is that wave III is greater than wave I, which is the way it must be. This does mean we can now expect a wave V up? A wave V should be equal to wave I, which means that wave V should top out at 1389 (1128 - 1011 = 117 + 1272 = 1389). Finally, note that the chart follows the first rule of Elliott wave, namely the chart must look right. This one definitely does. |
Has been a technical analyst since 1969, and has worked as a futures and options trader with First Financial Futures in Johannesburg, South Africa.
| Address: | 3256 West 24th Ave |
| Vancouver, BC | |
| Phone # for sales: | 6042634214 |
| E-mail address: | petroosp@gmail.com |
Click here for more information about our publications!
Comments
Date: 03/23/11Rank: 5Comment: Good call.
Dick

Request Information From Our Sponsors
- StockCharts.com, Inc.
- Candle Patterns
- Candlestick Charting Explained
- Intermarket Technical Analysis
- John Murphy on Chart Analysis
- John Murphy's Chart Pattern Recognition
- John Murphy's Market Message
- MurphyExplainsMarketAnalysis-Intermarket Analysis
- MurphyExplainsMarketAnalysis-Visual Analysis
- StockCharts.com
- Technical Analysis of the Financial Markets
- The Visual Investor
- VectorVest, Inc.
- Executive Premier Workshop
- One-Day Options Course
- OptionsPro
- Retirement Income Workshop
- Sure-Fire Trading Systems (VectorVest, Inc.)
- Trading as a Business Workshop
- VectorVest 7 EOD
- VectorVest 7 RealTime/IntraDay
- VectorVest AutoTester
- VectorVest Educational Services
- VectorVest OnLine
- VectorVest Options Analyzer
- VectorVest ProGraphics v6.0
- VectorVest ProTrader 7
- VectorVest RealTime Derby Tool
- VectorVest Simulator
- VectorVest Variator
- VectorVest Watchdog
