HOT TOPICS LIST
- MACD
- Fibonacci
- RSI
- Gann
- ADXR
- Stochastics
- Volume
- Triangles
- Futures
- Cycles
- Volatility
- ZIGZAG
- MESA
- Retracement
- Aroon
INDICATORS LIST
LIST OF TOPICS
PRINT THIS ARTICLE
by Koos van der Merwe
Who would have dreamed that a market meltdown would be caused by an earthquake in Japan and the tsunami that followed? Is this the time to buy?
Position: Hold
Koos van der Merwe
Has been a technical analyst since 1969, and has worked as a futures and options trader with First Financial Futures in Johannesburg, South Africa.
PRINT THIS ARTICLE
ELLIOTT WAVE
Is It Time To Buy?
03/17/11 08:22:26 AMby Koos van der Merwe
Who would have dreamed that a market meltdown would be caused by an earthquake in Japan and the tsunami that followed? Is this the time to buy?
Position: Hold
| It was the riots in the Middle East that started the markets moving down. Then nature stepped in with the earthquake in Japan. We knew that a correction was due. We even knew that it would be sometime end of February to early March, but we did not know what would cause it. That the loss of human lives in world tragedies is the cause is hurtful. Does one take financial opportunity to profit from those tragedies? Unfortunately, that is the name of the game. |

|
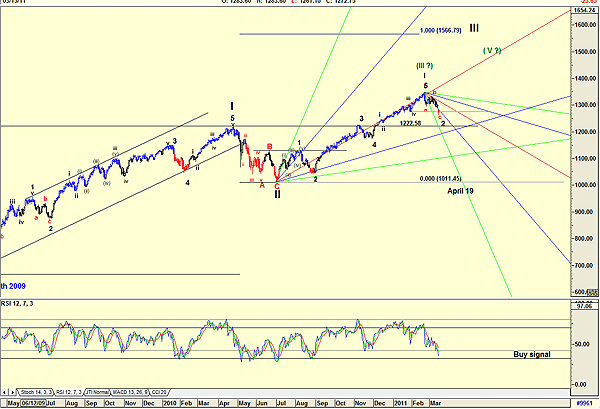
| FIGURE 1: S&P 500, DAILY |
| Graphic provided by: AdvancedGET. |
| |
| Figure 1 is the S&P daily chart, which does show that the correction could be over for the following reasons: 1. Wave C at 1272.75 is testing the low of the fourth wave of lesser degree. 2. The relative strength index is in the buy zone. My wave count does, however, suggest an Elliott wave count that is questionable. Is the wave 5 top at 1355.21 the high of wave III? Looking at the chart, I am showing that wave III should be at least 1566.79. This is because wave III should be equal to the length of wave I. However, the rule is that should wave III be less than wave I, then wave V will be less than wave III. I have shown this count in green figures with a question mark. Personally, I believe that the count is a wave 1 and wave 2 of wave III. Yes, I am overly optimistic, but never forget, Elliott wave theory is only a signpost, and one can change the count a little way down the road at the next signpost. Finally, note that the Gann fans are suggesting a date of April 19. Is this the date for the low of the current correction? Should the correction continue and fall below 122.58, the top of wave I, then the entire count changes. The wave count will then be wave I of wave III. This does seem unlikely, but with the unrest in the Middle East possibly escalating, this could be very feasible. The market is very iffy at the moment, something that is very often found at major market bottoms, so watch the market carefully. Above all, do not try and catch a falling knife, but do your homework and buy only as and when the market recovers. |
Has been a technical analyst since 1969, and has worked as a futures and options trader with First Financial Futures in Johannesburg, South Africa.
| Address: | 3256 West 24th Ave |
| Vancouver, BC | |
| Phone # for sales: | 6042634214 |
| E-mail address: | petroosp@gmail.com |
Click here for more information about our publications!
PRINT THIS ARTICLE

Request Information From Our Sponsors
- VectorVest, Inc.
- Executive Premier Workshop
- One-Day Options Course
- OptionsPro
- Retirement Income Workshop
- Sure-Fire Trading Systems (VectorVest, Inc.)
- Trading as a Business Workshop
- VectorVest 7 EOD
- VectorVest 7 RealTime/IntraDay
- VectorVest AutoTester
- VectorVest Educational Services
- VectorVest OnLine
- VectorVest Options Analyzer
- VectorVest ProGraphics v6.0
- VectorVest ProTrader 7
- VectorVest RealTime Derby Tool
- VectorVest Simulator
- VectorVest Variator
- VectorVest Watchdog
- StockCharts.com, Inc.
- Candle Patterns
- Candlestick Charting Explained
- Intermarket Technical Analysis
- John Murphy on Chart Analysis
- John Murphy's Chart Pattern Recognition
- John Murphy's Market Message
- MurphyExplainsMarketAnalysis-Intermarket Analysis
- MurphyExplainsMarketAnalysis-Visual Analysis
- StockCharts.com
- Technical Analysis of the Financial Markets
- The Visual Investor
