HOT TOPICS LIST
- MACD
- Fibonacci
- RSI
- Gann
- ADXR
- Stochastics
- Volume
- Triangles
- Futures
- Cycles
- Volatility
- ZIGZAG
- MESA
- Retracement
- Aroon
INDICATORS LIST
LIST OF TOPICS
PRINT THIS ARTICLE
by Mike Carr, CMT
When one of the world's largest holders of an asset sells, there are bound to be signs in the market.
Position: N/A
Mike Carr, CMT
Mike Carr, CMT, is a member of the Market Technicians Association, and editor of the MTA's newsletter, Technically Speaking. He is also the author of "Smarter Investing in Any Economy: The Definitive Guide to Relative Strength Investing," and "Conquering the Divide: How to Use Economic Indicators to Catch Stock Market Trends."
PRINT THIS ARTICLE
TECHNICAL ANALYSIS
Ten-Year Rates May Show Effect Of PIMCO's Selling
03/16/11 08:50:11 AMby Mike Carr, CMT
When one of the world's largest holders of an asset sells, there are bound to be signs in the market.
Position: N/A
| Over the past week, PIMCO confirmed it had been a seller of US Treasury securities. The PIMCO Total Return Fund is the largest bond mutual fund, with assets of about $240 billion, according to recent reports. Sales appear to have totaled at least $40 billion since the start of the year. PIMCO manages other funds, and the selling may not have been confined to this fund, meaning the total sales may have been significantly higher. |
| Bond prices have an inverse relationship to interest rates -- higher prices equate to lower rates. This is because the amount of interest a bond pays is generally fixed, so if prices decline, the interest payment represents a larger percentage payout on the investment. Veteran traders know this but novice traders sometimes don't understand their investments as well as they should, so reviewing the basics never hurts. |
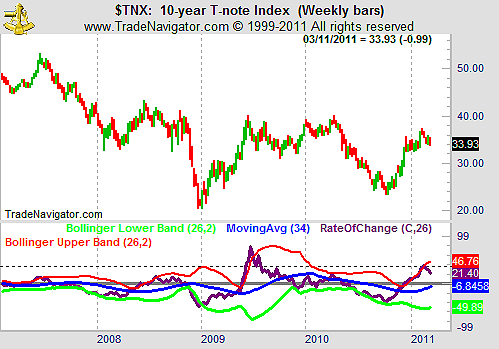
| Figure 1 shows the rate on the 10-year Treasury note. The 26-week rate of change (ROC) indicator is also shown, and that indicator is bounded with Bollinger bands. Rates bottomed in October 2010 and moved sharply higher. The ROC peaked above 37%, only the second time it reached this level in the past 10 years. At that point, the ROC also breached its upper Bollinger band, indicating that move was unusually fast since the Bollinger bands are designed to contain routine market action. |

|
| FIGURE 1: $TNX: WEEKLY. A weekly chart of the 10-year interest rate shows the recent increase in rates was unusually steep. |
| Graphic provided by: Trade Navigator. |
| |
| In hindsight, the rapid rise was most likely due to the large selloff now attributed to PIMCO. While traders may not have known why rates were going up, the ROC moving above its moving average, the blue line in Figure 1, was a signal that rates were going higher and bond prices were falling. After the news breaks, traders can learn why the trade worked, but at least in this case, the chart was ahead of the news, and now that the news is out, rates may pause or even decline. |
Mike Carr, CMT, is a member of the Market Technicians Association, and editor of the MTA's newsletter, Technically Speaking. He is also the author of "Smarter Investing in Any Economy: The Definitive Guide to Relative Strength Investing," and "Conquering the Divide: How to Use Economic Indicators to Catch Stock Market Trends."
| Website: | www.moneynews.com/blogs/MichaelCarr/id-73 |
| E-mail address: | marketstrategist@gmail.com |
Click here for more information about our publications!
PRINT THIS ARTICLE

Request Information From Our Sponsors
- StockCharts.com, Inc.
- Candle Patterns
- Candlestick Charting Explained
- Intermarket Technical Analysis
- John Murphy on Chart Analysis
- John Murphy's Chart Pattern Recognition
- John Murphy's Market Message
- MurphyExplainsMarketAnalysis-Intermarket Analysis
- MurphyExplainsMarketAnalysis-Visual Analysis
- StockCharts.com
- Technical Analysis of the Financial Markets
- The Visual Investor
- VectorVest, Inc.
- Executive Premier Workshop
- One-Day Options Course
- OptionsPro
- Retirement Income Workshop
- Sure-Fire Trading Systems (VectorVest, Inc.)
- Trading as a Business Workshop
- VectorVest 7 EOD
- VectorVest 7 RealTime/IntraDay
- VectorVest AutoTester
- VectorVest Educational Services
- VectorVest OnLine
- VectorVest Options Analyzer
- VectorVest ProGraphics v6.0
- VectorVest ProTrader 7
- VectorVest RealTime Derby Tool
- VectorVest Simulator
- VectorVest Variator
- VectorVest Watchdog
