HOT TOPICS LIST
- MACD
- Fibonacci
- RSI
- Gann
- ADXR
- Stochastics
- Volume
- Triangles
- Futures
- Cycles
- Volatility
- ZIGZAG
- MESA
- Retracement
- Aroon
INDICATORS LIST
LIST OF TOPICS
PRINT THIS ARTICLE
by Billy Williams
Cotton is ginning up some serious profits in its current bull run, and using both volume and simple moving averages can show you when to enter and profit if you know how.
Position: Accumulate
Billy Williams
Billy Williams has been trading the markets for 27 years, specializing in momentum trading with stocks and options.
PRINT THIS ARTICLE
Moving Averages And Volume Reveal Strong Trades In Cotton
03/16/11 08:44:55 AMby Billy Williams
Cotton is ginning up some serious profits in its current bull run, and using both volume and simple moving averages can show you when to enter and profit if you know how.
Position: Accumulate
| Commodities begin to take greater control of the direction of the market and appear to be offering investors and traders alike new opportunities as demand for physical resources begin to climb. The US equity market is still shaky from the 2008 crash and present economic growth is anemic, while stagnant high unemployment compounds the problem. Abroad, most industrialized countries are not faring much better, but as emerging markets such as China and India begin to bloom, their growth is being fueled by rising demand for energy and physical resources that are the cornerstone of their economic engines. This demand is not as recent as most talking heads would have you believe, as this phenomenon is not something that has only recently been discovered by the sheer fact that competition for these resources have been with us for at least eight years. However, it's the alarming realization that more countries are competing for these limited resources that has become apparent to Western countries that are now finding they are competing on equal footing with emerging markets, which are looking to gain a foothold in the global economy. |

|
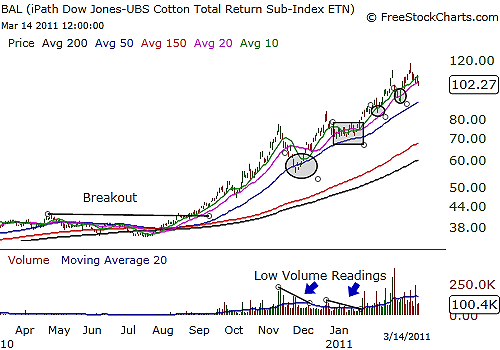
| FIGURE 1: BAL. BAL broke out in August 2010 as the demand for cotton spiked higher, driving BAL into a bullish run. Over the course of trading upward, BAL has had a combination of low-volume entries along its moving averages, offering support and shallow pullbacks on rising volume, which offered smart traders the opportunity enter the bullish trend. |
| Graphic provided by: www.freestockcharts.com. |
| |
| Textiles have been a growing industry in countries such as China as well as most of Asia, and the growing price of cotton is reflected in its chart. Cotton's price action had been meandering for a long time until August 2010, when a lateral breakout occurred and a new uptrend began. Using the USB Cotton Total Return Index (BAL) exchange traded fund (ETF), you could observe a strong breakout upward during that time frame, as BAL has gained more than 150% from this price level and looks ready to go higher. Trading volume in BAL has tripled from a 20-day average of 25,000 shares traded daily in late September 2010, tripling to more than 155,000 shares traded currently. The cash inflows into BAL are steadily climbing as demand for cotton rises, which further strengths the current bullish trend. |
| Using a combination of long-term, intermediate-term, and short-term moving averages in the form of 10-day, 20-day, 50-day, 150-day, and 200-day simple moving averages (SMAs), you can see that each is stacked in consecutive order as expected when a solid trend is in place. Each SMA represents a set price average over a given time period, with the 20-day and 50-day SMA offering firm resistance during normal pullbacks in this ETF's price action, which offers the opportunity to enter BAL as the trend climbs higher. Look for BAL to pull back to the 20-day and 50-day SMAs on light volume before resuming its upward climb before considering taking a long position. Trade volume represents the activity between buyers and sellers, while light volume during price pullbacks reveals that sellers have not forced price down into a bearish trend. As price rises, buying volume should increase, which further confirms that buyers have resumed control over the direction of BAL. |
| Factoring in inflation as the US and other countries print more currency to prop up their economies in the face of economic slowdown and with more dollars flooding the market, it takes more currency to buy the same quantity of goods. Using technical tools such as SMAs and volume will help you know when to enter the move and profit handsomely. |
Billy Williams has been trading the markets for 27 years, specializing in momentum trading with stocks and options.
| Company: | StockOptionSystem.com |
| E-mail address: | stockoptionsystem.com@gmail.com |
Traders' Resource Links | |
| StockOptionSystem.com has not added any product or service information to TRADERS' RESOURCE. | |
Click here for more information about our publications!
Comments
Date: 03/22/11Rank: 5Comment:

|

Request Information From Our Sponsors
- StockCharts.com, Inc.
- Candle Patterns
- Candlestick Charting Explained
- Intermarket Technical Analysis
- John Murphy on Chart Analysis
- John Murphy's Chart Pattern Recognition
- John Murphy's Market Message
- MurphyExplainsMarketAnalysis-Intermarket Analysis
- MurphyExplainsMarketAnalysis-Visual Analysis
- StockCharts.com
- Technical Analysis of the Financial Markets
- The Visual Investor
- VectorVest, Inc.
- Executive Premier Workshop
- One-Day Options Course
- OptionsPro
- Retirement Income Workshop
- Sure-Fire Trading Systems (VectorVest, Inc.)
- Trading as a Business Workshop
- VectorVest 7 EOD
- VectorVest 7 RealTime/IntraDay
- VectorVest AutoTester
- VectorVest Educational Services
- VectorVest OnLine
- VectorVest Options Analyzer
- VectorVest ProGraphics v6.0
- VectorVest ProTrader 7
- VectorVest RealTime Derby Tool
- VectorVest Simulator
- VectorVest Variator
- VectorVest Watchdog
