HOT TOPICS LIST
- MACD
- Fibonacci
- RSI
- Gann
- ADXR
- Stochastics
- Volume
- Triangles
- Futures
- Cycles
- Volatility
- ZIGZAG
- MESA
- Retracement
- Aroon
INDICATORS LIST
LIST OF TOPICS
PRINT THIS ARTICLE
by Donald W. Pendergast, Jr.
The S&P 500 may have already made an enduring, multimonth high, but the permabears are likely disgusted with the very slow rate of descent in the broad US markets. Here's a quick look at the top relative strength stock in the .SPX, for those convinced that a good long breakout entry point is at hand.
Position: N/A
Donald W. Pendergast, Jr.
Donald W. Pendergast is a financial markets consultant who offers specialized services to stock brokers and high net worth individuals who seek a better bottom line for their portfolios.
PRINT THIS ARTICLE
REL. STR COMPARATIVE
With Tesoro, Buy The Strongest Stocks On The Dips?
03/16/11 08:32:11 AMby Donald W. Pendergast, Jr.
The S&P 500 may have already made an enduring, multimonth high, but the permabears are likely disgusted with the very slow rate of descent in the broad US markets. Here's a quick look at the top relative strength stock in the .SPX, for those convinced that a good long breakout entry point is at hand.
Position: N/A
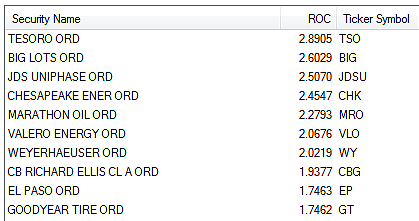
| Any large-cap stock that can more than double in the span of seven months would seem to be worthy of inclusion in any comparative relative strength scan (also known as an "exploration," if you're a user of MetaStock 11 software); when we run all 500 Standard & Poor's 500 components against the .SPX itself, we find that shares of Tesoro Corp. (TSO) are demonstrating mammoth relative strength vs. the index, warranting a closer look at its daily and/or weekly charts. Other big-cap energy sector names also make the top 10 cut in this scan, too, stocks like MRO, CHK, EP, and VLO are also outperforming the .SPX over the last 13 weeks. See Figure 1. |

|
| FIGURE 1. Five of the top 10 comparative relative strength stocks (over the past 13 weeks vs. the .SPX) hail from the energy sector. Interestingly, we also see the technology, retail, automotive, real estate, and lumber/paper industry groups and/or sectors represented in the list, too. |
| Graphic provided by: MetaStock. |
| Graphic provided by: MetaStock Explorer. |
| |
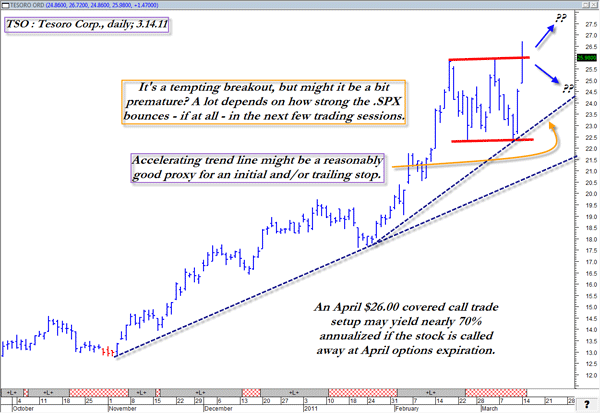
| I credit a great deal of my charting skills (such as they are, and a work in progress) to James Dines and his co-laborers at "The Dines Letter," a leading, investment advisory newsletter. One thing I came to realize as I pored over the charts in the "Letter" was that once a trend got up and running, it tended to keep on running, ignoring minor pullbacks more often than seemed reasonable. In major bull markets (in any given stock or commodity market), it always seemed to pay to give the existing trend every benefit of the doubt, regardless of what the news media, chat room pals, and coworkers may have been opining. Currently, TSO has already shrugged off several smaller pullbacks on the rise toward $25 and now may be busting higher out of an expanding consolidation pattern -- one happening in conjunction with a nice breakaway gap to boot (Figure 2). Some technicians seem to believe that a major uptrend like this needs a larger period of consolidation before a meaningful breakout move takes hold, but sometimes, the best plan is to just look at the chart and leave the theorizing on the shelf. This is particularly true in the case of covered-call trade setups, which tend to be less risky than a normal stock-only long entry. |

|
| FIGURE 2: TSO. For covered-call traders, this long breakout trade setup probably looks a lot less risky than it does to stock-only swing/breakout traders. Given the volatile nature of the global situation now, most traders might be better served sticking with the less risky route in TSO -- going with the April $26 covered call. |
| Graphic provided by: MetaStock. |
| Graphic provided by: MetaStock CS Scientific Expert Advisor. |
| |
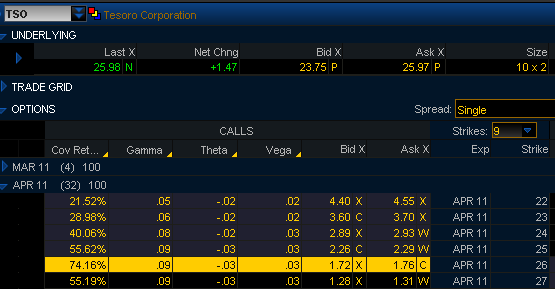
| It's fairly rare to see such an attractive annualized rate of return on a short-term covered call trade, but here it is -- this thing will earn close to 70% annualized if the shares are called away at April option expiration. As far as trade management goes, why not just use the latest uptrend line as a combo initial/trailing stop, no matter what happens? Maybe you get a daily close or two beneath the line and close the whole trade out, no questions asked. Or perhaps the stock catches a bid and really starts ramping higher, in which case, that trendline could be a very good tool to help you manage the trade in a stress-free manner for the life of it. See Figure 3. |

|
| FIGURE 3: COVERED CALL. Here, 70% annualized rates of return on a covered call almost seems impossible in an era of substandard interest rates, but the evidence is right in front of our eyes. Proper trade management and risk control remains vitally important to covered-call traders, no matter how lovely a potential gain may be. |
| Graphic provided by: Thinkorswim. |
| |
| The combination of a strong relative strength stock, a major broad market index near a short-term support level, and an ultra-high potential short-term rate of return on a breakout stock's covered-call play all seem to add up to a relatively low-risk long trade setup for conservative traders who might be otherwise too timid to plunge into an otherwise very strange and chaotic market situation. Do some more research on your own and see if this trade idea still passes muster with your own set of criteria. |
Donald W. Pendergast is a financial markets consultant who offers specialized services to stock brokers and high net worth individuals who seek a better bottom line for their portfolios.
| Title: | Writer, market consultant |
| Company: | Linear Trading Systems LLC |
| Jacksonville, FL 32217 | |
| Phone # for sales: | 904-239-9564 |
| E-mail address: | lineartradingsys@gmail.com |
Traders' Resource Links | |
| Linear Trading Systems LLC has not added any product or service information to TRADERS' RESOURCE. | |
Click here for more information about our publications!
Comments

Request Information From Our Sponsors
- StockCharts.com, Inc.
- Candle Patterns
- Candlestick Charting Explained
- Intermarket Technical Analysis
- John Murphy on Chart Analysis
- John Murphy's Chart Pattern Recognition
- John Murphy's Market Message
- MurphyExplainsMarketAnalysis-Intermarket Analysis
- MurphyExplainsMarketAnalysis-Visual Analysis
- StockCharts.com
- Technical Analysis of the Financial Markets
- The Visual Investor
- VectorVest, Inc.
- Executive Premier Workshop
- One-Day Options Course
- OptionsPro
- Retirement Income Workshop
- Sure-Fire Trading Systems (VectorVest, Inc.)
- Trading as a Business Workshop
- VectorVest 7 EOD
- VectorVest 7 RealTime/IntraDay
- VectorVest AutoTester
- VectorVest Educational Services
- VectorVest OnLine
- VectorVest Options Analyzer
- VectorVest ProGraphics v6.0
- VectorVest ProTrader 7
- VectorVest RealTime Derby Tool
- VectorVest Simulator
- VectorVest Variator
- VectorVest Watchdog
