HOT TOPICS LIST
- MACD
- Fibonacci
- RSI
- Gann
- ADXR
- Stochastics
- Volume
- Triangles
- Futures
- Cycles
- Volatility
- ZIGZAG
- MESA
- Retracement
- Aroon
INDICATORS LIST
LIST OF TOPICS
PRINT THIS ARTICLE
by Andrew Hetherington
Where will Intel (INTC) and the Philadelphia Semiconductor Index (SOX) go? It's an interesting thought since I heard an analyst being optimistic last week. I knew that was reason enough to look for pessimism.
Position: N/A
Andrew Hetherington
Classic Dow Theorist who trades as a pure technician, using pattern recognition.
PRINT THIS ARTICLE
HEAD & SHOULDERS
Chips, Chips, Chips
02/21/02 02:48:08 PMby Andrew Hetherington
Where will Intel (INTC) and the Philadelphia Semiconductor Index (SOX) go? It's an interesting thought since I heard an analyst being optimistic last week. I knew that was reason enough to look for pessimism.
Position: N/A
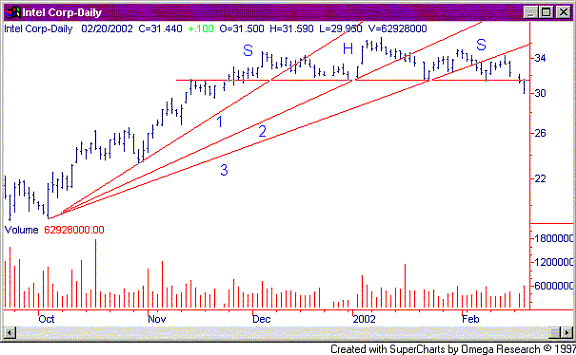
| Looking at the INTC chart in Figure 1 we see a 4-month head and shoulders pattern with pretty decent volume on its creation. Although it doesn't have what I refer to as perfect volume, it does look good. In addition, it also broke the third fan line 10 trading days ago in the $33.40 area on February 6, 2002. The neckline is in the $31.40 area and has now been broken with an increase in volume. On the downside this isn't a requisite but it's nice when it happens to give further indication of direction. After breaking the third fan line it had its typical pullback to the line in the $34.00 area. I say typical because this happens often. |
| If you were long on this equity and didn't sell on the downside break then this is the time to sell your long position. You should sell into the strength. Naturally, this suggestion is more for the short-term speculator. We will likely see another pullback to the neckline, which gives another opportunity for profit. The medium to long-term investors would probably not sell unless they expect a big downturn. Those interested in shorting the equity would take a position on this pullback. I'm expecting a down move to the $27.00 area but prognosticating how far these moves will be is a whole different art. |

|
| Figure 1: Daily chart for Intel (INTC). |
| Graphic provided by: SuperCharts. |
| |
| On the SOX Index in Figure 2 we have a similar pattern as Intel. This isn't unusual since it is the 900-pound gorilla. It broke the third fan line on Wednesday February 20, 2002. We also had a breach on this fan line to give an early indication 8 days ago. There is a 4-month multiple head and shoulders pattern, which unfortunately has no volume for confirmation. I don't like using this index since it has no volume but I know many are interested. The neckline is in the 510 area and I'm expecting it to drop with Intel. At this time I'm expecting a drop into the 460 area. |
 Figure 2: Daily chart for the Philadelphia Semiconductor Index (SOX). I have given my best estimate on where they will hesitate but remember when shorting to get out on the hard drops. The chips are falling. |
Classic Dow Theorist who trades as a pure technician, using pattern recognition.
| Toronto, Canada |
Click here for more information about our publications!
Comments
Date: 02/22/02Rank: 5Comment:
Date: 02/24/02Rank: 5Comment: Can I get a reference on how to place/utilize fans? Thanks, N Abraham
Date: 02/25/02Rank: 5Comment: Chips, Chips, Chips... It s so cool to see someone thinking like I am, and backing it up with evidence. There s not many around. Analysts pushing the chips, lol. I hope you re right. I hope I m right. Your examples say we are. This is why everytime you hear someone who knows it all while sitting in a coffee shop, they tout (and repeat) what they just heard a Merryl or Dean Whitter guy say.
A couple of good days on the markets and everyone s all happy again.
I don t even know where this message goes, but whoever s reading it - have a good one.
By the way, I just love it when everyone tells me I m wrong for a couple of days, until the charts (usually) fulfil the pattern.
TS
Date: 02/26/02Rank: 1Comment: without volume no conclusion and interpretation of this chart possible. in fact , the opposite is true: we are at the initiation of a bull move
Larry Leimgruber

|

Request Information From Our Sponsors
- StockCharts.com, Inc.
- Candle Patterns
- Candlestick Charting Explained
- Intermarket Technical Analysis
- John Murphy on Chart Analysis
- John Murphy's Chart Pattern Recognition
- John Murphy's Market Message
- MurphyExplainsMarketAnalysis-Intermarket Analysis
- MurphyExplainsMarketAnalysis-Visual Analysis
- StockCharts.com
- Technical Analysis of the Financial Markets
- The Visual Investor
- VectorVest, Inc.
- Executive Premier Workshop
- One-Day Options Course
- OptionsPro
- Retirement Income Workshop
- Sure-Fire Trading Systems (VectorVest, Inc.)
- Trading as a Business Workshop
- VectorVest 7 EOD
- VectorVest 7 RealTime/IntraDay
- VectorVest AutoTester
- VectorVest Educational Services
- VectorVest OnLine
- VectorVest Options Analyzer
- VectorVest ProGraphics v6.0
- VectorVest ProTrader 7
- VectorVest RealTime Derby Tool
- VectorVest Simulator
- VectorVest Variator
- VectorVest Watchdog
