HOT TOPICS LIST
- MACD
- Fibonacci
- RSI
- Gann
- ADXR
- Stochastics
- Volume
- Triangles
- Futures
- Cycles
- Volatility
- ZIGZAG
- MESA
- Retracement
- Aroon
INDICATORS LIST
LIST OF TOPICS
PRINT THIS ARTICLE
by Chaitali Mohile
Will the extremely bullish indicators allow the Energy Select Sector to continue the rally?
Position: N/A
Chaitali Mohile
Active trader in the Indian stock markets since 2003 and a full-time writer. Trading is largely based upon technical analysis.
PRINT THIS ARTICLE
TECHNICAL INDICATORS
XLE Is Highly Overbought
03/09/11 02:47:32 PMby Chaitali Mohile
Will the extremely bullish indicators allow the Energy Select Sector to continue the rally?
Position: N/A
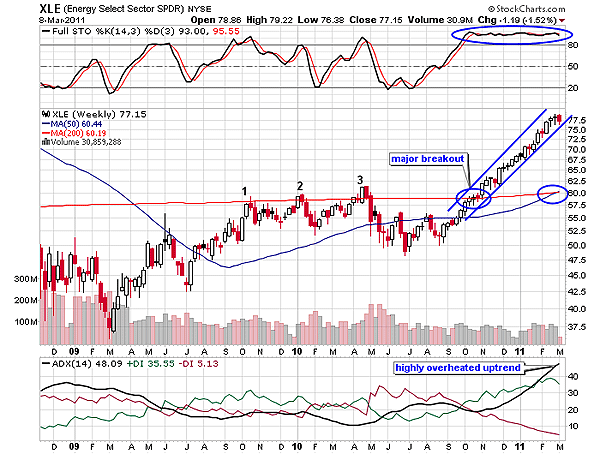
| After a robust correction in 2008, the Energy Select Sector SPDR (XLE) has been significantly under bearish pressure. A bullish trend could hardly develop in this period, as the selling pressure was much stronger. According to Figure 1, the long-term trend was either weak or captured by the bears till XLE was influenced by the 200-day moving average (MA) resistance. The relief rally that began in March 2009 was suppressed by the 200-day MA. XLE plunged three times from this resistance (see the numbers in Figure 1), retracing toward the 50-day moving average (MA) support. XLE rallied within the support-resistance of the two MAs. The 200-day MA has divided the price chart exactly in two parts. |
| The full stochastic (14,3,3) was range-bound between the 80 and 20 levels. In the chart in Figure 1 you can see that there was a lack of bullish strengh in XLE to surge. The RSI had established support at the oversold level (20). Eventually, XLE initiated a fresh upward rally with the support of the 50-day MA. The distance between the two MAs had diminished, so it was easier for XLE to breach the robust 200-day MA resistance. In addition, the average directional index (ADX) (14) moved in favor of the bulls, and the stochastic surged above the 80 levels. After a long period of about two years, these two indicators turned healthily bullish. As a result, fresh bullish sentiments were generated, helping XLE ascend comfortably. |

|
| FIGURE 1: XLE, WEEKLY. The converging moving averages are likely to undergo the bullish crossover. |
| Graphic provided by: StockCharts.com. |
| |
| The rally from the breakout point $60 to $77.50 was steady but one sided. Both indicators gradually moved higher in the extremely bullish regions. The stochastic oscillator has a unique feature of moving flat in an overbought or oversold region without harming the main trend or the price action. But if the period of the flat movement extends more than four to six months, then the directional rally is likely to reverse. In Figure 1, XLE is overbought since October 2010. Therefore, the momentum indicator would plunge a few points to create additional room for the rally to surge higher. The uptrend is also overheated, indicating the reversal possibilities. In addition, the steep vertical rallies are dangerous indications, as they sometimes collapse like a house of cards. |
| Although XLE is not a weak index, the price chart does not show immediate support apart from the two MAs. Traders need to wait for the confirmed bullish moving average crossover on the price chart in Figure 1 (see the blue circle). Considering the technical indicators and the signals on the price chart, XLE is likely to plunge a few points or turn volatile. Due to the extremely bullish conditions, it would be difficult for XLE to sustain at these higher levels. |
Active trader in the Indian stock markets since 2003 and a full-time writer. Trading is largely based upon technical analysis.
| Company: | Independent |
| Address: | C1/3 Parth Indraprasth Towers. Vastrapur |
| Ahmedabad, Guj 380015 | |
| E-mail address: | chaitalimohile@yahoo.co.in |
Traders' Resource Links | |
| Independent has not added any product or service information to TRADERS' RESOURCE. | |
Click here for more information about our publications!
Comments
Date: 03/12/11Rank: 5Comment: A very informative article. should also give your analysis on nifty , sensex

Request Information From Our Sponsors
- VectorVest, Inc.
- Executive Premier Workshop
- One-Day Options Course
- OptionsPro
- Retirement Income Workshop
- Sure-Fire Trading Systems (VectorVest, Inc.)
- Trading as a Business Workshop
- VectorVest 7 EOD
- VectorVest 7 RealTime/IntraDay
- VectorVest AutoTester
- VectorVest Educational Services
- VectorVest OnLine
- VectorVest Options Analyzer
- VectorVest ProGraphics v6.0
- VectorVest ProTrader 7
- VectorVest RealTime Derby Tool
- VectorVest Simulator
- VectorVest Variator
- VectorVest Watchdog
- StockCharts.com, Inc.
- Candle Patterns
- Candlestick Charting Explained
- Intermarket Technical Analysis
- John Murphy on Chart Analysis
- John Murphy's Chart Pattern Recognition
- John Murphy's Market Message
- MurphyExplainsMarketAnalysis-Intermarket Analysis
- MurphyExplainsMarketAnalysis-Visual Analysis
- StockCharts.com
- Technical Analysis of the Financial Markets
- The Visual Investor
