HOT TOPICS LIST
- MACD
- Fibonacci
- RSI
- Gann
- ADXR
- Stochastics
- Volume
- Triangles
- Futures
- Cycles
- Volatility
- ZIGZAG
- MESA
- Retracement
- Aroon
INDICATORS LIST
LIST OF TOPICS
PRINT THIS ARTICLE
by Koos van der Merwe
Leap is a wireless communications provider that offers wireless services under the Cricket brand. Leap's Cricket service offerings provide customers with unlimited access to wireless voice and data services for a flat rate without requiring a fixed-term contract. It provides wireless services at a significantly lower cost than many of its competitors.
Position: Buy
Koos van der Merwe
Has been a technical analyst since 1969, and has worked as a futures and options trader with First Financial Futures in Johannesburg, South Africa.
PRINT THIS ARTICLE
REL. STR OSCILL
A Look At Leap, The Wireless Provider
03/09/11 08:36:06 AMby Koos van der Merwe
Leap is a wireless communications provider that offers wireless services under the Cricket brand. Leap's Cricket service offerings provide customers with unlimited access to wireless voice and data services for a flat rate without requiring a fixed-term contract. It provides wireless services at a significantly lower cost than many of its competitors.
Position: Buy
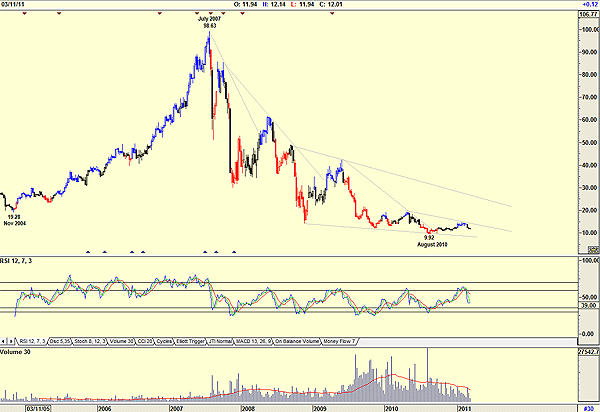
| Figure 1, a weekly chart, shows how the price rose from a low of $19.28 in November 2004 to a high of $98.63 by July 2007. Since then, the price has been dropping, reaching a low of $9.92 by August 2010. The price seems to be pretty static at that level. The chart shows how the weekly price continually broke downtrend resistance lines as it fell. Volume at first rose, supporting the share price collapse, but appears to be rising as the price increases and falling on a correction. This does suggest strength. However, the relative strength index (RSI) has given a sell signal at a level well below the 70 horizontal line, but in line with previous sell signals. There is no specific pattern that catches our attention. |

|
| FIGURE 1: LEAP, WEEKLY |
| Graphic provided by: AdvancedGET. |
| |
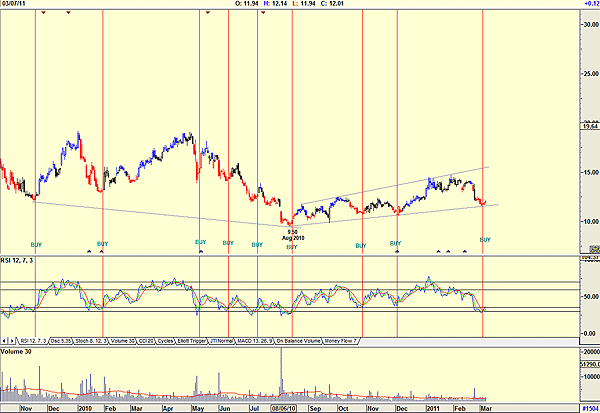
| The daily chart, Figure 2, does show that the RSI has given a buy signal. Volume appears to be average, and the chart pattern shown by the trendlines is a broadening formation, suggesting uncertainty. One positive is that previous buy signals by the RSI did give us a reasonable profit. |

|
| FIGURE 2: LEAP, DAILY |
| Graphic provided by: AdvancedGET. |
| |
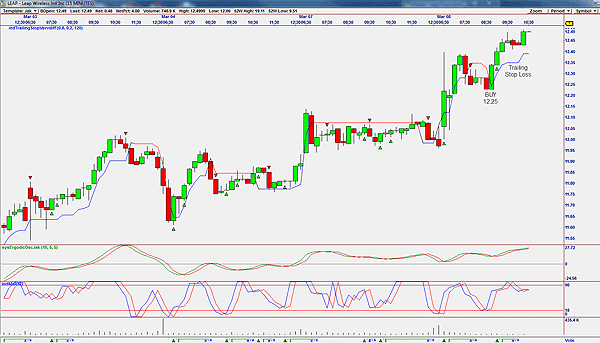
| Figure 3 is a 15-minute OmniTrader chart that triggered the buy signal. Note how the vote line as been remarkably accurate in its buy signal. We would use the trailing stop to close a position. The two indicators, the ergodic oscillator and a three-point RSI signal, are used as visual additions to the vote line buy signal. Neither the weekly or daily charts suggested that this stock could be a good buy, which means that we would not hold it for the long term. Figure 3, however, does suggest that the share is very good for daytrading. |

|
| FIGURE 3: LEAP, 15-MINUTE |
| Graphic provided by: OmniTrader. |
| |
Has been a technical analyst since 1969, and has worked as a futures and options trader with First Financial Futures in Johannesburg, South Africa.
| Address: | 3256 West 24th Ave |
| Vancouver, BC | |
| Phone # for sales: | 6042634214 |
| E-mail address: | petroosp@gmail.com |
Click here for more information about our publications!
Comments
Date: 03/11/11Rank: 5Comment:

Request Information From Our Sponsors
- VectorVest, Inc.
- Executive Premier Workshop
- One-Day Options Course
- OptionsPro
- Retirement Income Workshop
- Sure-Fire Trading Systems (VectorVest, Inc.)
- Trading as a Business Workshop
- VectorVest 7 EOD
- VectorVest 7 RealTime/IntraDay
- VectorVest AutoTester
- VectorVest Educational Services
- VectorVest OnLine
- VectorVest Options Analyzer
- VectorVest ProGraphics v6.0
- VectorVest ProTrader 7
- VectorVest RealTime Derby Tool
- VectorVest Simulator
- VectorVest Variator
- VectorVest Watchdog
- StockCharts.com, Inc.
- Candle Patterns
- Candlestick Charting Explained
- Intermarket Technical Analysis
- John Murphy on Chart Analysis
- John Murphy's Chart Pattern Recognition
- John Murphy's Market Message
- MurphyExplainsMarketAnalysis-Intermarket Analysis
- MurphyExplainsMarketAnalysis-Visual Analysis
- StockCharts.com
- Technical Analysis of the Financial Markets
- The Visual Investor
