HOT TOPICS LIST
- MACD
- Fibonacci
- RSI
- Gann
- ADXR
- Stochastics
- Volume
- Triangles
- Futures
- Cycles
- Volatility
- ZIGZAG
- MESA
- Retracement
- Aroon
INDICATORS LIST
LIST OF TOPICS
PRINT THIS ARTICLE
by Chaitali Mohile
The bullish journey of Covidien plc is likely to turn reluctant at the current higher levels.
Position: N/A
Chaitali Mohile
Active trader in the Indian stock markets since 2003 and a full-time writer. Trading is largely based upon technical analysis.
PRINT THIS ARTICLE
SUPPORT & RESISTANCE
Covidien Entering Resistance Area
03/07/11 02:00:54 PMby Chaitali Mohile
The bullish journey of Covidien plc is likely to turn reluctant at the current higher levels.
Position: N/A
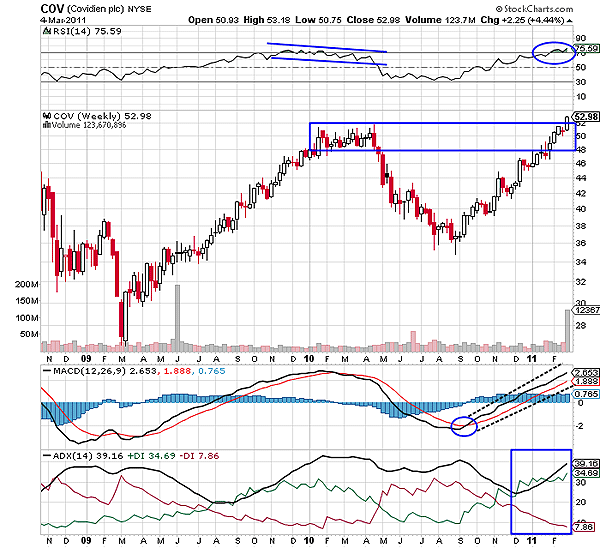
| A rally initiated by a bullish engulfing pattern in March 2009 had a wonderful trip from $28 to $50 (Figure 1). This bullish rally of Covidien plc (COV) offered hefty profit to all its traders and investors. The relative strength index (RSI) (14), the moving average convergence/divergence (MACD) (12,26,9), and the average directional movement index (ADX) (14) moved upward along with the price rally, strengthening the stock. After an extensive advance rally, COV consolidated for about three months in the range of $48 to $51. A negative divergence of the RSI (14) and an overheated uptrend were indications of the consolidation in Figure 1. However, COV plunged from these higher levels instead of breaking upward. |

|
| FIGURE 1: COV, WEEKLY |
| Graphic provided by: StockCharts.com. |
| |
| The reversal rally increased bearish pressure, developing an intermediate downtrend for the stock. After shedding 14 points, COV established support and initiated a fresh relief rally. The bearish trend reversed, the RSI (14) surged from 30 levels, and the MACD (12,26,9) turned positive due to the new upward rally. Soon COV recovered and its price drifted back to the 48 - 52 level. The stock has reached its resistance zone that was generated by the earlier consolidation. Therefore, the upper range at the 52 levels will be a very crucial resistance level for COV. We can see in Figure 1 that the stock is about to breach this hurdle. Once again the ADX (14) is ready to hit the overheated uptrend levels. The RSI (14) is jittery in an overbought region; as a result, the stock is likely to slow down during the bullish breakout (above $52). |

|
| FIGURE 2: COV, MONTHLY |
| Graphic provided by: StockCharts.com. |
| |
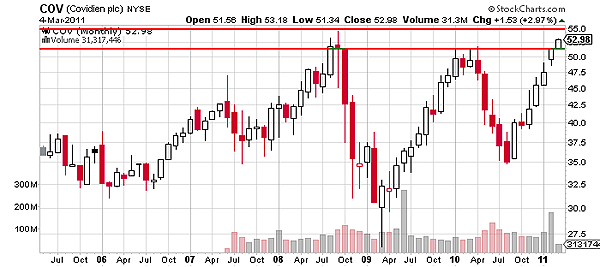
| In 2008, COV had formed a top at $55. We can see a bearish doji with a small real body with long lower shadow and short upper shadow, followed by a large red bearish candlestick in Figure 2. This evening star candlestick pattern terminated the prior ascending rally. Hence, $55 would be a robust resistance for the COV. Later, another hurdle was formed at 50-51 levels by the rally initiated in March 2009. Thus, the ongoing price action has two resistances of $50-51 and $55. The stock has converted the first resistance ($51) to support and is inching toward $55. The price action between this support-resistance would be very critical for the potential breakout. The trading range is wide, and therefore, short-term traders can enjoy quick profit booking trades. |
| However, an upward breakout of $55 would induce huge bullish forces, attracting fresh buyers. Hence, it is essential for COV to sustain in the bullish consolidation range of $51 and $55. |
Active trader in the Indian stock markets since 2003 and a full-time writer. Trading is largely based upon technical analysis.
| Company: | Independent |
| Address: | C1/3 Parth Indraprasth Towers. Vastrapur |
| Ahmedabad, Guj 380015 | |
| E-mail address: | chaitalimohile@yahoo.co.in |
Traders' Resource Links | |
| Independent has not added any product or service information to TRADERS' RESOURCE. | |
Click here for more information about our publications!
PRINT THIS ARTICLE

Request Information From Our Sponsors
- StockCharts.com, Inc.
- Candle Patterns
- Candlestick Charting Explained
- Intermarket Technical Analysis
- John Murphy on Chart Analysis
- John Murphy's Chart Pattern Recognition
- John Murphy's Market Message
- MurphyExplainsMarketAnalysis-Intermarket Analysis
- MurphyExplainsMarketAnalysis-Visual Analysis
- StockCharts.com
- Technical Analysis of the Financial Markets
- The Visual Investor
- VectorVest, Inc.
- Executive Premier Workshop
- One-Day Options Course
- OptionsPro
- Retirement Income Workshop
- Sure-Fire Trading Systems (VectorVest, Inc.)
- Trading as a Business Workshop
- VectorVest 7 EOD
- VectorVest 7 RealTime/IntraDay
- VectorVest AutoTester
- VectorVest Educational Services
- VectorVest OnLine
- VectorVest Options Analyzer
- VectorVest ProGraphics v6.0
- VectorVest ProTrader 7
- VectorVest RealTime Derby Tool
- VectorVest Simulator
- VectorVest Variator
- VectorVest Watchdog
