HOT TOPICS LIST
- MACD
- Fibonacci
- RSI
- Gann
- ADXR
- Stochastics
- Volume
- Triangles
- Futures
- Cycles
- Volatility
- ZIGZAG
- MESA
- Retracement
- Aroon
INDICATORS LIST
LIST OF TOPICS
PRINT THIS ARTICLE
by Alan R. Northam
Will the short-term correction turn into an intermediate-term correction?
Position: N/A
Alan R. Northam
Alan Northam lives in the Dallas, Texas area and as an electronic engineer gave him an analytical mind from which he has developed a thorough knowledge of stock market technical analysis. His abilities to analyze the future direction of the stock market has allowed him to successfully trade of his own portfolio over the last 30 years. Mr. Northam is now retired and trading the stock market full time. You can reach him at inquiry@tradersclassroom.com or by visiting his website at http://www.tradersclassroom.com. You can also follow him on Twitter @TradersClassrm.
PRINT THIS ARTICLE
LIN. REGTREND
DJIA Faces Possible Intermediate-Term Downtrend
03/02/11 09:28:51 AMby Alan R. Northam
Will the short-term correction turn into an intermediate-term correction?
Position: N/A
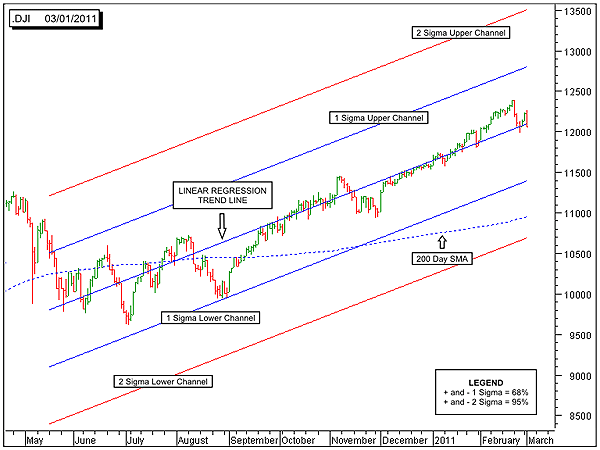
| The Dow Jones Industrial Average (DJIA) may be entering into an intermediate-term downtrend. Intermediate-term trends normally last from a few weeks to a few months. If, in fact, the DJIA does enter into an intermediate-term downtrend, Figure 1 shows three possible price targets for the selloff. |

|
| FIGURE 1: .DJI, DAILY. Here's the 200-day linear regression trendline along with its upper and lower one sigma and two sigma channel lines. |
| Graphic provided by: MetaStock. |
| |
| Figure 1 shows the 200-day linear regression trendline along with the upper and lower one sigma channel lines and the upper and lower two sigma channel lines. Of the closing prices, 68% are statistically bound within the plus and minus one sigma channel lines. When all the price action is within these lines, as is shown in Figure 1, the trend is considered to be strong. The upper and lower two sigma lines contain 95% of all closing price action. When price moves outside the plus and minus two sigma channel lines, it signals an important event, as this does not occur often. Normally, this important event signals a trend reversal. Figure 1 also shows the 200-day simple moving average. Thus, we have three possible targets for a downward intermediate-term trend to end at 1) the minus one sigma channel line; 2) the 200-day simple moving average; and 3) the minus two sigma channel line. In Figure 2, I have zoomed in on the price action to be able to see more detail. The green upsloping lines are the 50-day linear regression trendline along with its upper and lower two sigma channel lines. The 50-day linear regression trendline and its channel lines represent the slope and boundaries of the intermediate-term uptrend. Any price action outside these boundaries represents a significant intermediate-term event. A closing price below the lower two sigma channel line would signal a high-probability trend reversal from up to down. |

|
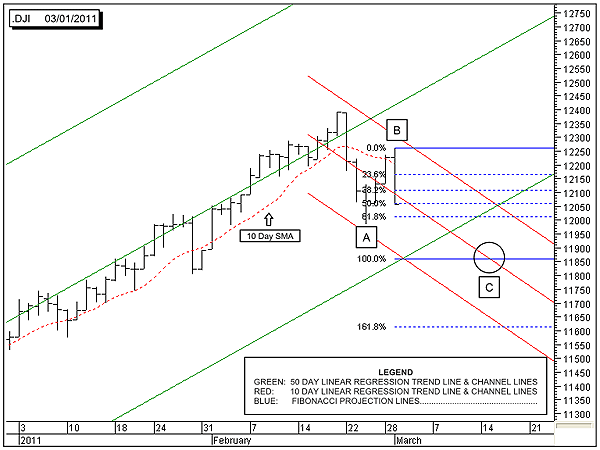
| FIGURE 2: .DJI, DAILY. And here's the 50-day linear regression trendline and its upper and lower channel lines in green, the 10-day linear regression trendline, and its upper and lower channel lines in red, and the Fibonacci projection lines in blue. |
| Graphic provided by: MetaStock. |
| |
| The red downsloping lines in Figure 2 are the 10-day linear regression trendline along with its upper and lower two sigma channel lines. The middle downsloping red line is the 10-day linear regression trendline and represents the path that price should follow if price continues to move in the downward direction. Next, I add a little Elliott wave theory to our analysis. According to the Elliott wave theory, a price normally moves in a downward direction in three waves labeled ABC. In Figure 2, I have labeled waves A and B. According to Elliott wave theory, price should make one more downward move to complete wave C. The Elliott wave theory also states that wave C is normally the same length of wave A. The theory also indicates that the relationship between waves A and C are guidelines, not a rule. Elliott wave theory also states that guidelines can be broken, but rules cannot. Therefore, it is not necessary that wave C be the same length as wave A. After that, I use the Fibonacci projection tool on waves A and B to show the Fibonacci projections for the possible price targets for wave C. Several common relationships between waves A and C for a target price for wave C is where wave C is 61.8% or 0.618 times the length of wave A, 100% or 1.0 times the length of wave A, and 161.8% or 1.618 times the length of wave A. The most common is 100%, or 1.0 times the length of wave A. In Figure 2, I have drawn a circle around the intersection of the 10-day linear regression trendline and the 100% Fibonacci projection line. This gives a price target for the completion of wave C. Here is what is important to note about this analysis. The 10-day linear regression trendline, or the short-term downtrend, is in a strong downtrend. As a result, we should expect the DJIA to complete wave C. As long as the short-term downtrend remains strong, we should also expect wave C to be complete at the price and time target shown on the chart. Note that this price and time target is outside the lower boundary line of the lower green 50-day linear regression channel line. This indicates a high probability that the intermediate-term trend could be in the process of turning down. |
| In conclusion, it appears that the DJIA is currently undergoing a short-term correction. However, if price falls below the lower two sigma 50-day linear regression channel line, the probability becomes very high that the market is undergoing more than a short-term downward correction in an ongoing long-term uptrend. It could indicate that the DJIA is undergoing an intermediate-term downward correction whose price targets are shown in Figure 1. A move below the lower two sigma 200-day linear regression channel line would signal a long-term trend reversal from up to down. |
Alan Northam lives in the Dallas, Texas area and as an electronic engineer gave him an analytical mind from which he has developed a thorough knowledge of stock market technical analysis. His abilities to analyze the future direction of the stock market has allowed him to successfully trade of his own portfolio over the last 30 years. Mr. Northam is now retired and trading the stock market full time. You can reach him at inquiry@tradersclassroom.com or by visiting his website at http://www.tradersclassroom.com. You can also follow him on Twitter @TradersClassrm.
| Garland, Tx | |
| Website: | www.tradersclassroom.com |
| E-mail address: | inquiry@tradersclassroom.com |
Click here for more information about our publications!
PRINT THIS ARTICLE

Request Information From Our Sponsors
- StockCharts.com, Inc.
- Candle Patterns
- Candlestick Charting Explained
- Intermarket Technical Analysis
- John Murphy on Chart Analysis
- John Murphy's Chart Pattern Recognition
- John Murphy's Market Message
- MurphyExplainsMarketAnalysis-Intermarket Analysis
- MurphyExplainsMarketAnalysis-Visual Analysis
- StockCharts.com
- Technical Analysis of the Financial Markets
- The Visual Investor
- VectorVest, Inc.
- Executive Premier Workshop
- One-Day Options Course
- OptionsPro
- Retirement Income Workshop
- Sure-Fire Trading Systems (VectorVest, Inc.)
- Trading as a Business Workshop
- VectorVest 7 EOD
- VectorVest 7 RealTime/IntraDay
- VectorVest AutoTester
- VectorVest Educational Services
- VectorVest OnLine
- VectorVest Options Analyzer
- VectorVest ProGraphics v6.0
- VectorVest ProTrader 7
- VectorVest RealTime Derby Tool
- VectorVest Simulator
- VectorVest Variator
- VectorVest Watchdog
