HOT TOPICS LIST
- MACD
- Fibonacci
- RSI
- Gann
- ADXR
- Stochastics
- Volume
- Triangles
- Futures
- Cycles
- Volatility
- ZIGZAG
- MESA
- Retracement
- Aroon
INDICATORS LIST
LIST OF TOPICS
PRINT THIS ARTICLE
by Mike Carr, CMT
Stocks and oil markets saw large price moves in the week of February 25, 2011, and volatility indexes tracking these markets also experienced large swings.
Position: N/A
Mike Carr, CMT
Mike Carr, CMT, is a member of the Market Technicians Association, and editor of the MTA's newsletter, Technically Speaking. He is also the author of "Smarter Investing in Any Economy: The Definitive Guide to Relative Strength Investing," and "Conquering the Divide: How to Use Economic Indicators to Catch Stock Market Trends."
PRINT THIS ARTICLE
VOLATILITY
As Markets Spike, So Does Volatility
03/02/11 08:49:52 AMby Mike Carr, CMT
Stocks and oil markets saw large price moves in the week of February 25, 2011, and volatility indexes tracking these markets also experienced large swings.
Position: N/A
| The CBOE Volatility Index (VIX) is a widely followed indicator of stock market volatility. It is intended to track large-cap stocks and is based upon the expected level of the trading range that the Standard & Poor's 500 will experience in the next 30 days. Since 1990, the VIX has been as low as 9.3 in 1993 and as high as 89.5 in 2008. Higher levels are generally associated with the panic price moves associated with bear markets. |
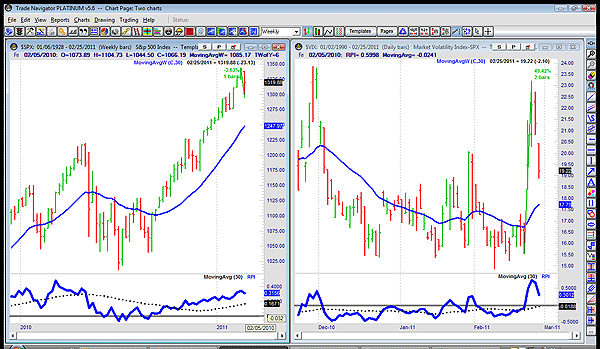
| In the last full week of February, the S&P 500 fell as much as 3.6% from its high of the previous week. The VIX was up a little over 49% during that price move (Figure 1). The volatility index lived up to its name and gave back more than half those gains as the prices of stocks recovered. |

|
| FIGURE 1: VIX. Stock prices tend to be negatively correlated with the VIX. |
| Graphic provided by: Trade Navigator. |
| |
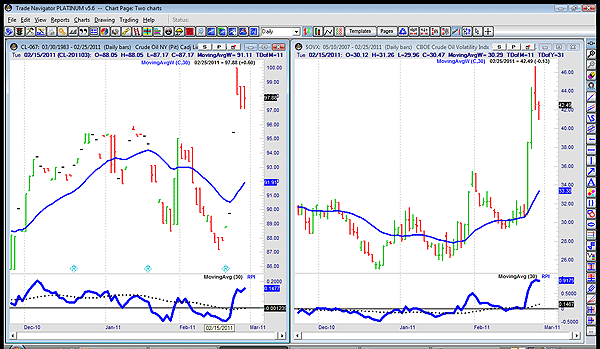
| While a similar pattern of lower prices and higher volatility was seen in the NASDAQ 100, a different picture emerged in the oil market. The price of crude oil climbed along with volatility. This follows the pattern seen in 2008 as crude oil spiked to record levels; initially, the volatility index moved higher with price, but volatility continued to reach new highs as the price of oil crashed. See Figure 2. |

|
| FIGURE 2: CRUDE AND VIX. Both the price of oil and its volatility index increased at the same time as traders reacted to news out of Libya. |
| Graphic provided by: Trade Navigator. |
| |
| While rules of thumb, such as the negative correlation between prices and volatility, often apply in the markets, they are not always true. Traders can see volatility spike higher along with prices. Volatility is often said to track fear in markets, moving higher as fear increases, and this is most likely the case in the oil markets, where both prices and fears seem to be going up. |
Mike Carr, CMT, is a member of the Market Technicians Association, and editor of the MTA's newsletter, Technically Speaking. He is also the author of "Smarter Investing in Any Economy: The Definitive Guide to Relative Strength Investing," and "Conquering the Divide: How to Use Economic Indicators to Catch Stock Market Trends."
| Website: | www.moneynews.com/blogs/MichaelCarr/id-73 |
| E-mail address: | marketstrategist@gmail.com |
Click here for more information about our publications!
Comments
Date: 03/08/11Rank: 4Comment:

Request Information From Our Sponsors
- StockCharts.com, Inc.
- Candle Patterns
- Candlestick Charting Explained
- Intermarket Technical Analysis
- John Murphy on Chart Analysis
- John Murphy's Chart Pattern Recognition
- John Murphy's Market Message
- MurphyExplainsMarketAnalysis-Intermarket Analysis
- MurphyExplainsMarketAnalysis-Visual Analysis
- StockCharts.com
- Technical Analysis of the Financial Markets
- The Visual Investor
- VectorVest, Inc.
- Executive Premier Workshop
- One-Day Options Course
- OptionsPro
- Retirement Income Workshop
- Sure-Fire Trading Systems (VectorVest, Inc.)
- Trading as a Business Workshop
- VectorVest 7 EOD
- VectorVest 7 RealTime/IntraDay
- VectorVest AutoTester
- VectorVest Educational Services
- VectorVest OnLine
- VectorVest Options Analyzer
- VectorVest ProGraphics v6.0
- VectorVest ProTrader 7
- VectorVest RealTime Derby Tool
- VectorVest Simulator
- VectorVest Variator
- VectorVest Watchdog
