HOT TOPICS LIST
- MACD
- Fibonacci
- RSI
- Gann
- ADXR
- Stochastics
- Volume
- Triangles
- Futures
- Cycles
- Volatility
- ZIGZAG
- MESA
- Retracement
- Aroon
INDICATORS LIST
LIST OF TOPICS
PRINT THIS ARTICLE
by Koos van der Merwe
Global unrest was the cause of the expected correction in the market. With the DJIA going strongly positive on February 28, is this suggesting the correction is over?
Position: Sell
Koos van der Merwe
Has been a technical analyst since 1969, and has worked as a futures and options trader with First Financial Futures in Johannesburg, South Africa.
PRINT THIS ARTICLE
GANN ANGLE
Is The Correction Over?
02/28/11 11:46:47 AMby Koos van der Merwe
Global unrest was the cause of the expected correction in the market. With the DJIA going strongly positive on February 28, is this suggesting the correction is over?
Position: Sell
| As much as the investor would love to see the market go bull, and as much as I would love to see the list of stocks I am starting to bottom-pick move into positive territory, my charts are telling me, "No!" The market has still some ways down to go. |

|
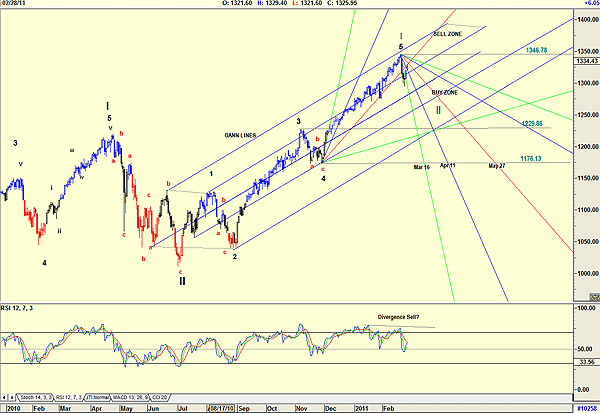
| FIGURE 1: S&P 500, DAILY |
| Graphic provided by: AdvancedGET. |
| |
| Figure 1 is a chart of the Standard & Poor's 500 and shows the following: a. Gann fans are suggesting the following dates as a possible turning point: March 16, April 11, and May 27. Do note the dates are highlighted as the fan crosses the horizontal line drawn from the low of the previous Gann fan. b. Buy zone-sell zone Gann lines are suggesting buy and sell zones for the S&P 500. The S&P 500 is still in a sell zone. c. The relative strength index (RSI) is below the 50 levels, suggesting that we could see a move up in the downward correction. d. An Elliott wave count suggesting that wave I of wave III has to correct to the fourth wave of lesser degree, somewhere between 1176.13 and 1229.86. As much as I would like to believe that the correction is over, my charts are suggesting that there is still a considerable amount of a downside. I would not be a buyer at present levels, but I would start looking once the index falls below the 1229.86 level. Should the price of the index rise above the 1346.78 level, then I would have to redo my Elliott wave count. At the moment, unfortunately, I must be bearish. |
Has been a technical analyst since 1969, and has worked as a futures and options trader with First Financial Futures in Johannesburg, South Africa.
| Address: | 3256 West 24th Ave |
| Vancouver, BC | |
| Phone # for sales: | 6042634214 |
| E-mail address: | petroosp@gmail.com |
Click here for more information about our publications!
PRINT THIS ARTICLE

|

Request Information From Our Sponsors
- StockCharts.com, Inc.
- Candle Patterns
- Candlestick Charting Explained
- Intermarket Technical Analysis
- John Murphy on Chart Analysis
- John Murphy's Chart Pattern Recognition
- John Murphy's Market Message
- MurphyExplainsMarketAnalysis-Intermarket Analysis
- MurphyExplainsMarketAnalysis-Visual Analysis
- StockCharts.com
- Technical Analysis of the Financial Markets
- The Visual Investor
- VectorVest, Inc.
- Executive Premier Workshop
- One-Day Options Course
- OptionsPro
- Retirement Income Workshop
- Sure-Fire Trading Systems (VectorVest, Inc.)
- Trading as a Business Workshop
- VectorVest 7 EOD
- VectorVest 7 RealTime/IntraDay
- VectorVest AutoTester
- VectorVest Educational Services
- VectorVest OnLine
- VectorVest Options Analyzer
- VectorVest ProGraphics v6.0
- VectorVest ProTrader 7
- VectorVest RealTime Derby Tool
- VectorVest Simulator
- VectorVest Variator
- VectorVest Watchdog
