HOT TOPICS LIST
- MACD
- Fibonacci
- RSI
- Gann
- ADXR
- Stochastics
- Volume
- Triangles
- Futures
- Cycles
- Volatility
- ZIGZAG
- MESA
- Retracement
- Aroon
INDICATORS LIST
LIST OF TOPICS
PRINT THIS ARTICLE
by Chaitali Mohile
Will the bullish breakout of Global Crossing Ltd. succeed?
Position: N/A
Chaitali Mohile
Active trader in the Indian stock markets since 2003 and a full-time writer. Trading is largely based upon technical analysis.
PRINT THIS ARTICLE
CHART ANALYSIS
GLBC Breakout
02/28/11 09:07:57 AMby Chaitali Mohile
Will the bullish breakout of Global Crossing Ltd. succeed?
Position: N/A
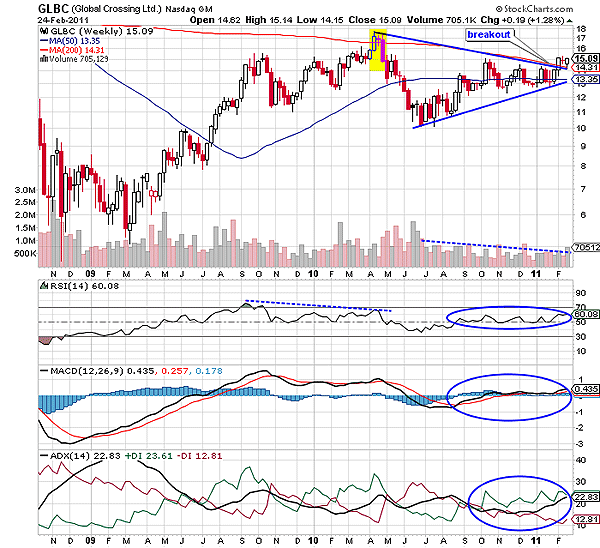
| In April 2010, Global Crossing Ltd. (GLBC) plunged, forming an evening star candlestick pattern near its 200-day moving average (MA) resistance. The bearish reversal candlestick pattern and a negative divergence of the relative strength index (RSI) (14) were indications that GLBC could be dragged lower, which it did. However, the stock stabilized immediately and began recovering the lost levels. The lower highs and higher lows formed a symmetrical triangle on the weekly time frame in Figure 1. The upper trendline and the 200-day MA have descended, generating robust bearish power for the stock to break in an upward direction. While ascending, GLBC established support at the 50-day moving average. |

|
| FIGURE 1: GLBC, WEEKLY. The stock has witnessed the bullish breakout. |
| Graphic provided by: StockCharts.com. |
| |
| Due to the converging trendlines of the symmetrical triangle, we cannot identify the exact breakout direction. Therefore, the trades are placed only after the confirmed breakout. In Figure 1, the symmetrical triangle has breached upwards and has converted resistance to support. Although the bullish breakout has occurred, the volume is not showing much enthusiasm. The average directional index (ADX) (14) shows a developing uptrend, but the relative strength index (RSI)(14) and moving average convergence/divergence (MACD) (12,26,9) are not convincing. The RSI (14) is fluctuating in the bullish zone. The narrowed gap between the MACD and trigger line are suggesting volatility in the breakout rally. |
| Usually, the bullish breakout attracts more buyers and increases the strength of the rally. This strength is reflected by the size as well as shapes of the candles. However, the bullish candles in Figure 1 are not reflecting the strength in the GLBC breakout. Therefore, the breakout rally is likely to be a little sluggish. |

|
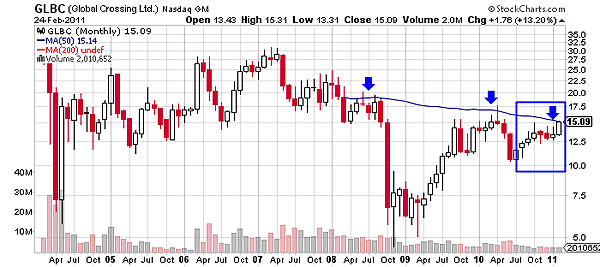
| FIGURE 2: GLBC, MONTHLY. The 50-day MA is the major hurdle to the upward rally. |
| Graphic provided by: StockCharts.com. |
| |
| Another reason for the weak price action is the 50-day MA resistance on the monthly time frame in Figure 2. This MA resistance has restricted GLBC many times (see arrows). The blue box shows the candlesticks with a small real body and long shadows. This signifies that the price is unable to be sustained at intraday highs and lows. Due to the MA resistance, the current rally is likely to get affected. But a breakout above the 50-day MA could bring about bullish strength in GLBC. |
Active trader in the Indian stock markets since 2003 and a full-time writer. Trading is largely based upon technical analysis.
| Company: | Independent |
| Address: | C1/3 Parth Indraprasth Towers. Vastrapur |
| Ahmedabad, Guj 380015 | |
| E-mail address: | chaitalimohile@yahoo.co.in |
Traders' Resource Links | |
| Independent has not added any product or service information to TRADERS' RESOURCE. | |
Click here for more information about our publications!
PRINT THIS ARTICLE

Request Information From Our Sponsors
- VectorVest, Inc.
- Executive Premier Workshop
- One-Day Options Course
- OptionsPro
- Retirement Income Workshop
- Sure-Fire Trading Systems (VectorVest, Inc.)
- Trading as a Business Workshop
- VectorVest 7 EOD
- VectorVest 7 RealTime/IntraDay
- VectorVest AutoTester
- VectorVest Educational Services
- VectorVest OnLine
- VectorVest Options Analyzer
- VectorVest ProGraphics v6.0
- VectorVest ProTrader 7
- VectorVest RealTime Derby Tool
- VectorVest Simulator
- VectorVest Variator
- VectorVest Watchdog
- StockCharts.com, Inc.
- Candle Patterns
- Candlestick Charting Explained
- Intermarket Technical Analysis
- John Murphy on Chart Analysis
- John Murphy's Chart Pattern Recognition
- John Murphy's Market Message
- MurphyExplainsMarketAnalysis-Intermarket Analysis
- MurphyExplainsMarketAnalysis-Visual Analysis
- StockCharts.com
- Technical Analysis of the Financial Markets
- The Visual Investor
