HOT TOPICS LIST
- MACD
- Fibonacci
- RSI
- Gann
- ADXR
- Stochastics
- Volume
- Triangles
- Futures
- Cycles
- Volatility
- ZIGZAG
- MESA
- Retracement
- Aroon
INDICATORS LIST
LIST OF TOPICS
PRINT THIS ARTICLE
by Andrew Hetherington
The double top formation can be an early warning of ID (impending doom) to come. A few recent examples of this formation can be seen on the charts of Cisco (CSCO) and Broadcom (BRCM).
Position: N/A
Andrew Hetherington
Classic Dow Theorist who trades as a pure technician, using pattern recognition.
PRINT THIS ARTICLE
DOUBLE TOPS
The Power of the Double Top
02/20/02 02:48:17 PMby Andrew Hetherington
The double top formation can be an early warning of ID (impending doom) to come. A few recent examples of this formation can be seen on the charts of Cisco (CSCO) and Broadcom (BRCM).
Position: N/A
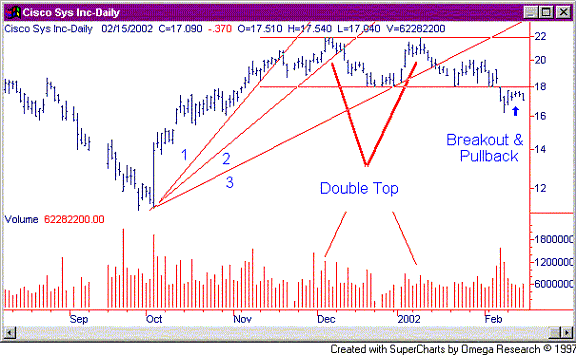
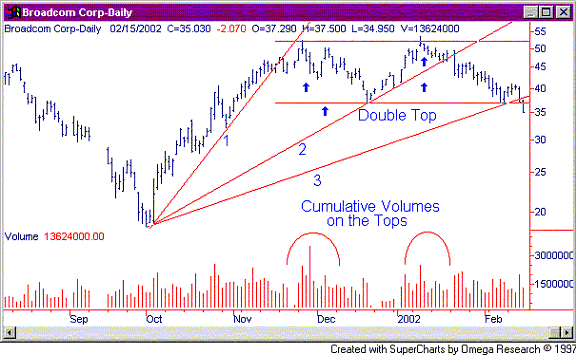
| The double top is a pattern that is created with intense interest on the first top and a lack of demand on the second top. The second top gives you the warning of falling demand and the slide in prices that is inevitable. Both tops need to be within a 3% range of one another and at least one month apart. In addition, there must be a drop or a reaction from the first top of at least 15%. This horizontal line across the first bottom in-between the two tops becomes your breakout confirmation. Naturally, there needs to be a breakout of at least 3% from this line. After the breakout, which need not be accompanied with an increase in volume, there is almost always a pullback to the line. This pullback will be on lighter volume than the breakout usually. This is where the short trader takes a position if they didn't get in on the breaking of the third fan line. |
| Cisco (CSCO) and Broadcom (BRCM) are two such examples. They have both confirmed double tops and are destined to drop. Cisco has an anticipated drop to the $14.00 area approximately. Broadcom has an estimated drop to the $28.00 area. Keep in mind that these are likely minimum targets, since they could go lower. However, if I were shorting these equities, I would use these buy back points to take profits off the table. It's important to remember, that shorting is best if you take the fast hard drops and get out. Making 10-20% over a period of a few days to a few weeks is a very good return. Don't let greed overcome your senses when shorting. You are trying to get out on the weakness, and not waiting for it to turn around on you, which could end up being a short squeeze rally. |

|
| Figure 1: Daily Chart for Cisco Systems Inc. (CSCO). |
| Graphic provided by: SuperCharts. |
| |
| Cisco has already broken down below the $18.00 horizontal line. It has had a pullback on typically light volume and on February 15, 2002 it gave the ideal opportunity to short with an intra-day high of $17.54. You would use the horizontal line at $18.00 as the buy stop, just in case the equity goes up instead of down. Make no mistake here though, it's heading lower. Your initial problem is to get through the previous low of $16.27. If it doesn't go through $16.27 on the first attempt, you buy back your short and take the profits off the table. I usually play within the pattern so I would have taken a position on the breaking of the third fan line. After it broke this line it retraced to the $20.00 area. Patience would have been important but rewarding. If it turned around you would place a buy stop around the third fan line in this scenario. The early warning was there once again. |
 Figure 2: Daily Chart for Broadcom Corp. (BRCM). Broadcom is in a similar position but is slightly behind. This is good for those who want to short it on the pullback to the $37.00 horizontal line, which is the buy stop point. If you are patient, I'm confident you will see it retrace up into the mid $36.00 area. The early warning came as usual on the breaking of the third fan line in the $37.50 area on Thursday with increasing volume on the downside. Impending doom was near. This is a good illustration why I rely so much on the fan lines. The break was telegraphed at what will be a protected sell point. It's all about limiting downside risk and increasing your chances for successful investing. If it doesn't retrace to our expected sell point then pass on it and look for other opportunities. |
| The double top should not be assumed to be taking place just because there are two tops close together with a reaction between them. This will get you into a heap of trouble. Watch the fan lines and the volume. If the volume is the least bit suspect don't short it. |
Classic Dow Theorist who trades as a pure technician, using pattern recognition.
| Toronto, Canada |
Click here for more information about our publications!
Comments
Date: 02/21/02Rank: 5Comment: pretty good article ,some inside always good .
Date: 02/23/02Rank: 5Comment:
Date: 02/25/02Rank: 5Comment: Well put. Good lesson.
Date: 02/26/02Rank: 5Comment:
Date: 02/26/02Rank: 5Comment: Can you refer me to where I could find explanation of fan lines. This is a new concept to me. Thank you
Mary Weathers
Date: 02/27/02Rank: 5Comment: HP - (Hewlett Packard)...
Kind of a descending, right shoulder, double, triple top, rectangle type thing, hitting resistance at 24.00 from Aug - Sept 2001. It faked back into the pattern in fall 2001 on the pullback then, too. Third fan line broke Jan. 22nd (a month ago).
TS
Date: 02/27/02Rank: 5Comment: HP - (Hewlett Packard)...
Kind of a descending, right shoulder, double, triple top, rectangle type thing (O.K... it s not a triple). But it s hitting resistance at 24.00 from Aug - Sept 2001. It faked back into the pattern in fall 2001 on the pullback then, too. Third fan line broke Jan. 22nd (a month ago). Might be the second time I ve sent this? I came back a half hour later and the script was still sitting here waiting to be sent. So I submitted it (again?)
TS
Date: 03/11/02Rank: 5Comment:
Date: 04/24/02Rank: 4Comment: this writer often mentions fan lines, but i can find no reference to them in your index. any suggestions

Request Information From Our Sponsors
- StockCharts.com, Inc.
- Candle Patterns
- Candlestick Charting Explained
- Intermarket Technical Analysis
- John Murphy on Chart Analysis
- John Murphy's Chart Pattern Recognition
- John Murphy's Market Message
- MurphyExplainsMarketAnalysis-Intermarket Analysis
- MurphyExplainsMarketAnalysis-Visual Analysis
- StockCharts.com
- Technical Analysis of the Financial Markets
- The Visual Investor
- VectorVest, Inc.
- Executive Premier Workshop
- One-Day Options Course
- OptionsPro
- Retirement Income Workshop
- Sure-Fire Trading Systems (VectorVest, Inc.)
- Trading as a Business Workshop
- VectorVest 7 EOD
- VectorVest 7 RealTime/IntraDay
- VectorVest AutoTester
- VectorVest Educational Services
- VectorVest OnLine
- VectorVest Options Analyzer
- VectorVest ProGraphics v6.0
- VectorVest ProTrader 7
- VectorVest RealTime Derby Tool
- VectorVest Simulator
- VectorVest Variator
- VectorVest Watchdog
