

HOT TOPICS LIST
- MACD
- Fibonacci
- RSI
- Gann
- ADXR
- Stochastics
- Volume
- Triangles
- Futures
- Cycles
- Volatility
- ZIGZAG
- MESA
- Retracement
- Aroon
INDICATORS LIST
LIST OF TOPICS
PRINT THIS ARTICLE
by Chaitali Mohile
Healthcare Realty is trying to shift into a bullish zone.
Position: N/A
Chaitali Mohile
Active trader in the Indian stock markets since 2003 and a full-time writer. Trading is largely based upon technical analysis.
PRINT THIS ARTICLE
SUPPORT & RESISTANCE
HR At Support-Resistance
02/28/11 08:56:34 AMby Chaitali Mohile
Healthcare Realty is trying to shift into a bullish zone.
Position: N/A
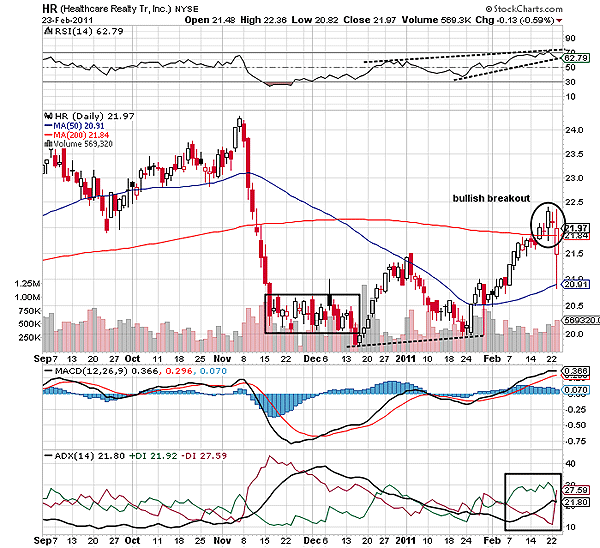
| Healthcare Realty Tr Inc. (HR) took a nose-dive from $24.50 to $20 in November 2010. The bearish force strengthened after breaching the 50-day and 200-day moving averages (MA). The long red candles are reflecting the selling pressure in the rally. During the bearish rally, a developing downtrend, indicated by the average directional index (ADX), (14) overheated, signifying the possibility of a trend reversal. Although the overheated trend reversed, it failed to initiate the pullback rally. We can see in Figure 1 that the stock consolidated in a very narrow range from $20 and $25.50. Before starting the upward rally, HR marginally breached the lower consolidation range. |
|
| FIGURE 1: HR, DAILY |
| Graphic provided by: StockCharts.com. |
| |
| Due to the weak trend development, the fresh bullish rally could not violate the 50-day MA resistance. The moving average convergence/divergence (MACD) (12,26,9) retraced by hitting the zero line resistance, indicating lack of bullish momentum in the price action. In addition, the jittery relative strength index (RSI) (14) was unable to establish support at the center line (50 levels), highlighting bearish strength. Thus, HR resumed its descending rally and made a lower high exactly at $20. The formation of the lower high on the price chart suggests bullish accommodation and the potential rally. Soon, HR converted the 50-day MA resistance to support and surged toward another robust resistance of the 200-day MA. Although the journey from the short-term MA support to the long-term MA (200-day) was strong and steady, the breakout was not. The doji candlesticks with the MA support shows uncertainty in Figure 1. |
| The relative strength index (RSI)(14) and moving average convergence/divergence (MACD)(12,26,9) are ascending in bullish territory but the bullish trend that developed during the rally is unstable. A big hollow red candle (seen on February 23, 2011), indicates that huge bearish pressure has emerged on the breakout rally. As a result, the bears are likely to capture the trend or shoot a war against the bulls. |
|
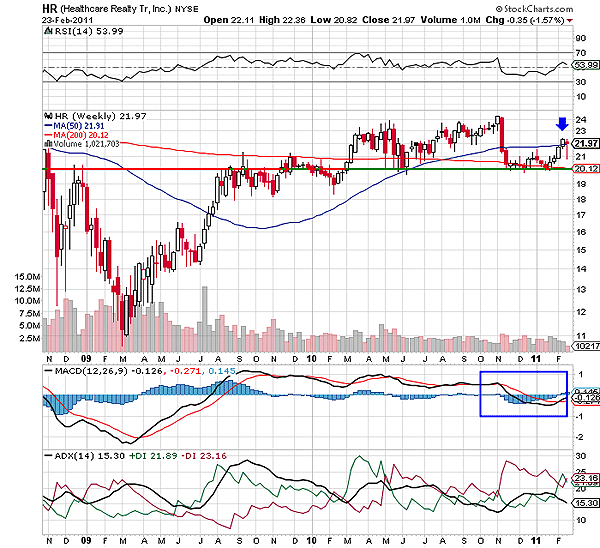
| FIGURE 2: HR, WEEKLY |
| Graphic provided by: StockCharts.com. |
| |
| The support-resistance line tool used in Figure 2 shows the accumulated strength at $20. This level had restricted the previous bullish rally and is extending support to the current price action. The downfall in November 2010 also halted at the same support line. Since the 200-day MA is coinciding with the support-resistance line, the support has robust bullish strength to weather the storm. The 50-day MA has suppressed the short-term pullback rally, indicating the bearish force. The RSI (14) and the MACD (12,26,9) look like they are reluctant to transition into the bullish zone, and the average directional movement index (ADX)(14) is indicating volatile consolidation. |
| Thus, HR would consolidate in the tight range between the 50-day and 200-day MA support-resistance zone. The efforts to shift in the bullish area would probably not be successful. |
Active trader in the Indian stock markets since 2003 and a full-time writer. Trading is largely based upon technical analysis.
| Company: | Independent |
| Address: | C1/3 Parth Indraprasth Towers. Vastrapur |
| Ahmedabad, Guj 380015 | |
| E-mail address: | chaitalimohile@yahoo.co.in |
Traders' Resource Links | |
| Independent has not added any product or service information to TRADERS' RESOURCE. | |
Click here for more information about our publications!
PRINT THIS ARTICLE

Request Information From Our Sponsors
- StockCharts.com, Inc.
- Candle Patterns
- Candlestick Charting Explained
- Intermarket Technical Analysis
- John Murphy on Chart Analysis
- John Murphy's Chart Pattern Recognition
- John Murphy's Market Message
- MurphyExplainsMarketAnalysis-Intermarket Analysis
- MurphyExplainsMarketAnalysis-Visual Analysis
- StockCharts.com
- Technical Analysis of the Financial Markets
- The Visual Investor
- VectorVest, Inc.
- Executive Premier Workshop
- One-Day Options Course
- OptionsPro
- Retirement Income Workshop
- Sure-Fire Trading Systems (VectorVest, Inc.)
- Trading as a Business Workshop
- VectorVest 7 EOD
- VectorVest 7 RealTime/IntraDay
- VectorVest AutoTester
- VectorVest Educational Services
- VectorVest OnLine
- VectorVest Options Analyzer
- VectorVest ProGraphics v6.0
- VectorVest ProTrader 7
- VectorVest RealTime Derby Tool
- VectorVest Simulator
- VectorVest Variator
- VectorVest Watchdog