HOT TOPICS LIST
- MACD
- Fibonacci
- RSI
- Gann
- ADXR
- Stochastics
- Volume
- Triangles
- Futures
- Cycles
- Volatility
- ZIGZAG
- MESA
- Retracement
- Aroon
INDICATORS LIST
LIST OF TOPICS
PRINT THIS ARTICLE
by Mike Carr, CMT
Price patterns tend to offer an incomplete picture of any market.
Position: N/A
Mike Carr, CMT
Mike Carr, CMT, is a member of the Market Technicians Association, and editor of the MTA's newsletter, Technically Speaking. He is also the author of "Smarter Investing in Any Economy: The Definitive Guide to Relative Strength Investing," and "Conquering the Divide: How to Use Economic Indicators to Catch Stock Market Trends."
PRINT THIS ARTICLE
CHART ANALYSIS
Cotton Prints An Outside Reversal Day
02/25/11 09:10:15 AMby Mike Carr, CMT
Price patterns tend to offer an incomplete picture of any market.
Position: N/A
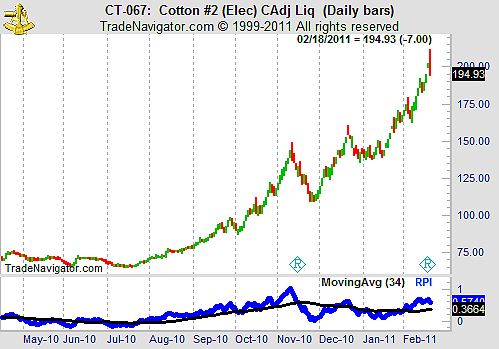
| On Friday, February 18, the price chart of cotton futures exhibited classic signs of a top (Figure 1). Prices opened sharply higher, rallied but fell through the range of the previous day and closed at the session low. Candlestick followers would have noted the previous day's action was a small range (a doji) indicative of market indecision and possibly setting up a market turn. |

|
| FIGURE 1: COTTON, DAILY. Here, cotton prices show a large range and declining day. |
| Graphic provided by: Trade Navigator. |
| |
| Visible in Figure 1 is a small R on the bottom of the price frame of the chart. This indicates a rollover day, a concept unique to futures and not encountered on stock charts. Futures contracts have a limited life and must be settled with delivery of the product or cash at expiration. In this way, futures bear a similarity to options. |
| At rollover, futures traders close contracts and move their trades into new contracts with more distant expiration days. The result is increased volume and volatility. Price bars tend to have large ranges on these days, and that means chartists should exercise caution when interpreting patterns. |
| Technical analyst John Magee is believed to have said that he didn't care about fundamentals or news; all he needed was a chart. Modern traders should follow at least the news to understand volatility. Cotton's chart may very well show a key reversal day, or it may just reflect trading related to rollover. We will only know in time. |
Mike Carr, CMT, is a member of the Market Technicians Association, and editor of the MTA's newsletter, Technically Speaking. He is also the author of "Smarter Investing in Any Economy: The Definitive Guide to Relative Strength Investing," and "Conquering the Divide: How to Use Economic Indicators to Catch Stock Market Trends."
| Website: | www.moneynews.com/blogs/MichaelCarr/id-73 |
| E-mail address: | marketstrategist@gmail.com |
Click here for more information about our publications!
Comments
Date: 03/01/11Rank: 5Comment:

Request Information From Our Sponsors
- StockCharts.com, Inc.
- Candle Patterns
- Candlestick Charting Explained
- Intermarket Technical Analysis
- John Murphy on Chart Analysis
- John Murphy's Chart Pattern Recognition
- John Murphy's Market Message
- MurphyExplainsMarketAnalysis-Intermarket Analysis
- MurphyExplainsMarketAnalysis-Visual Analysis
- StockCharts.com
- Technical Analysis of the Financial Markets
- The Visual Investor
- VectorVest, Inc.
- Executive Premier Workshop
- One-Day Options Course
- OptionsPro
- Retirement Income Workshop
- Sure-Fire Trading Systems (VectorVest, Inc.)
- Trading as a Business Workshop
- VectorVest 7 EOD
- VectorVest 7 RealTime/IntraDay
- VectorVest AutoTester
- VectorVest Educational Services
- VectorVest OnLine
- VectorVest Options Analyzer
- VectorVest ProGraphics v6.0
- VectorVest ProTrader 7
- VectorVest RealTime Derby Tool
- VectorVest Simulator
- VectorVest Variator
- VectorVest Watchdog
