HOT TOPICS LIST
- MACD
- Fibonacci
- RSI
- Gann
- ADXR
- Stochastics
- Volume
- Triangles
- Futures
- Cycles
- Volatility
- ZIGZAG
- MESA
- Retracement
- Aroon
INDICATORS LIST
LIST OF TOPICS
PRINT THIS ARTICLE
by Donald W. Pendergast, Jr.
Over the last few months, the selling pressure in the shares of Southwest Airlines has been relatively mild yet persistent. Will the newest swing sell signal in the stock precipitate a plunge to lower price levels?
Position: N/A
Donald W. Pendergast, Jr.
Donald W. Pendergast is a financial markets consultant who offers specialized services to stock brokers and high net worth individuals who seek a better bottom line for their portfolios.
PRINT THIS ARTICLE
TRADING SYSTEMS
Southwest Airlines On Approach To Lower Altitudes?
02/25/11 09:01:13 AMby Donald W. Pendergast, Jr.
Over the last few months, the selling pressure in the shares of Southwest Airlines has been relatively mild yet persistent. Will the newest swing sell signal in the stock precipitate a plunge to lower price levels?
Position: N/A
| The recent chaos in the world certainly haven't brought much in the way of comfort to owners of most airline stocks, although shares of Southwest Airlines (LUV) are still trading at value more than double what they were at the major March 2009 lows. Here's a look at an important, imminent support test for LUV, a test that is likely to be administered very soon by the emerging bullish forces now driving the broad market. |

|
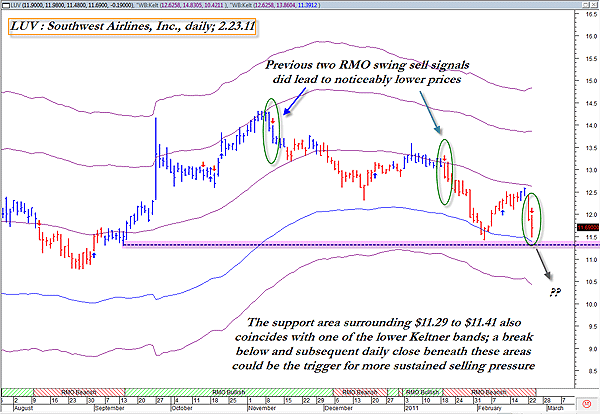
| FIGURE 1: LUV, DAILY. Nothing fancy here -- just a weak relative strength stock from an economically vulnerable industry group that is preparing to either make a successful test of support or to embark on a sustained period of "down south jukin'." |
| Graphic provided by: MetaStock. |
| |
| On Wednesday, there were 103 Rahul Mohindar (RMO) swing sell signals among the 500 component stocks that make up the mighty Standard & Poor's 500. Considering that there were also 78 RMO sell signals generated the previous trading session, it appears that a great many traders and investors are scrambling for the exits at the same time. One of the weakest of all the stocks giving RMO sell signals on Wednesday was LUV, and as we glance at its daily chart (Figure 1), we see that the stock is in a de facto downtrend (lower swing highs and lower swing lows) and that has indeed printed a new swing sell signal on a wide-range daily bar. |

|
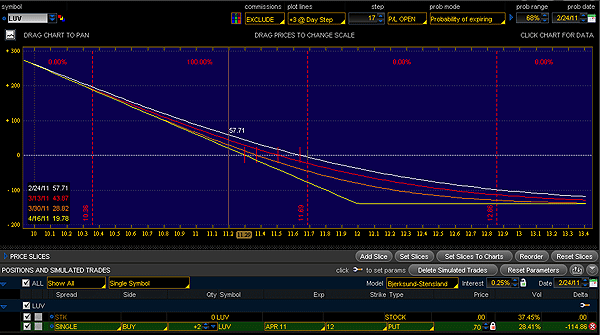
| FIGURE 2: LUV PUTS. Here's the risk/reward profile for the LUV $12 April 2011 puts described in the article. Bid-ask spreads are a bit loose in this stock, so be sure to play the intraday charts to make sure you get the best possible price -- on a pullback, if possible. |
| Graphic provided by: Thinkorswim. |
| |
| The horizontal dashed line on the chart depicts the nearest significant support level, one that also coincides with the closest Keltner band. If this area of support is broken on heavy volume, it may be a sign that the stock intends to seek lower altitude sooner rather than later. Shorting stock in such a volatile market doesn't seem too safe right now, not until the bear market is confirmed (assuming that is the ultimate outcome), but buying some $12 April put options looks a lot more attractive. See Figure 2. |
| If you can work a bid to pay no more than $0.70 to $0.75 (average price) for each put you intend to acquire, the risk/reward profile for this potential short setup looks very nice indeed. For example, say you can pick up one put for $0.60 on an intraday pullback (higher). You can always hold off on buying the other one until the down move really gets going; maybe you end up paying $0.75 or $0.80 for the second half of the position, attempting to hold on for a fast ride down toward the $10.25 to $10.40 area, which is the next general support area for LUV. If you buy two puts for a total of $140 before commissions, they'll generate a profit of about $190 if LUV falls to $10.35 by March 13, 2011. Conversely, if LUV decides to do a "touch & go," bouncing higher toward $12.60 (the area of the recent swing high) by the same date, your loss will come in at around $102 before commissions. So overall, this long put play is very attractive, based on the current technical posture of the chart and the particular options chosen for the trade. |
| A final note on this trade. Remember that when you're holding a long put or call option (instead of a spread), you are the owner of a financial instrument that is absolutely, positively guaranteed to lose all of its extrinsic value by option expiration Friday. Therefore, you need to select realistic profit target and stop-loss levels before you even put the trade on in order to make sure that you don't miss your opportunity to grab a decent profit on the first (which is usually the best) strong swing move in your position's favor. Hanging around, waiting for a subsequent swing to even more favorable price targets is usually a bad idea when holding long option positions, unless of course, you're holding longer-term puts and calls (LEAPS, and so on). For this trade, look to start grabbing profits somewhere south of $10.40 to 10.50 and then get out while the getting's good. |
Donald W. Pendergast is a financial markets consultant who offers specialized services to stock brokers and high net worth individuals who seek a better bottom line for their portfolios.
| Title: | Writer, market consultant |
| Company: | Linear Trading Systems LLC |
| Jacksonville, FL 32217 | |
| Phone # for sales: | 904-239-9564 |
| E-mail address: | lineartradingsys@gmail.com |
Traders' Resource Links | |
| Linear Trading Systems LLC has not added any product or service information to TRADERS' RESOURCE. | |
Click here for more information about our publications!
PRINT THIS ARTICLE

Request Information From Our Sponsors
- StockCharts.com, Inc.
- Candle Patterns
- Candlestick Charting Explained
- Intermarket Technical Analysis
- John Murphy on Chart Analysis
- John Murphy's Chart Pattern Recognition
- John Murphy's Market Message
- MurphyExplainsMarketAnalysis-Intermarket Analysis
- MurphyExplainsMarketAnalysis-Visual Analysis
- StockCharts.com
- Technical Analysis of the Financial Markets
- The Visual Investor
- VectorVest, Inc.
- Executive Premier Workshop
- One-Day Options Course
- OptionsPro
- Retirement Income Workshop
- Sure-Fire Trading Systems (VectorVest, Inc.)
- Trading as a Business Workshop
- VectorVest 7 EOD
- VectorVest 7 RealTime/IntraDay
- VectorVest AutoTester
- VectorVest Educational Services
- VectorVest OnLine
- VectorVest Options Analyzer
- VectorVest ProGraphics v6.0
- VectorVest ProTrader 7
- VectorVest RealTime Derby Tool
- VectorVest Simulator
- VectorVest Variator
- VectorVest Watchdog
